Evaluation of LEDs for Outdoor Signage Applications (2003)
The promise of brighter and more efficacious LEDs has encouraged their use in outdoor applications such as commercial backlighted signs. Outdoor signs commonly are constructed of neon and cold-cathode fluorescent lamps, but interest in using LEDs has been growing because of the potential for greater energy and maintenance savings and improved performance over current technologies.
Presently, there are no standards for signage in terms of luminance, brightness uniformity, or life. Therefore, in order to determine the suitability of LEDs for this application, the objective of this study was to evaluate the performance of LEDs in outdoor signage and identify criteria for setting acceptance standards. Because neon and cold-cathode fluorescent lamps are the most widely used sources for this application, LRC researchers used these as references against which to compare the system performance of LED signs. As part of this study researchers also conducted human factors evaluations to understand how people perceive and accept a sign's brightness uniformity, with a subsequent goal of developing a metric for evaluating uniformity.
EXPERIMENT - PERFORMANCE COMPARISON
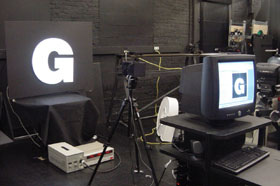
The first part of the study evaluated the system performance of red LED signs and white LED signs against reference neon and cold-cathode fluorescent signs. Thirteen signs were constructed in the shape of an uppercase character G and at a height of 24 inches. Researchers collected and evaluated the light output, spectral power distribution, temperature, and power characteristics of each sign.
CONCLUSIONS - PERFORMANCE COMPARISON
- Depending on the configuration, a red LED sign could use 20% to 60% less power than the neon sign at the same light output.
- The most efficient white LED system is still 40% less efficient than the cold-cathode fluorescent sign at the same light output.
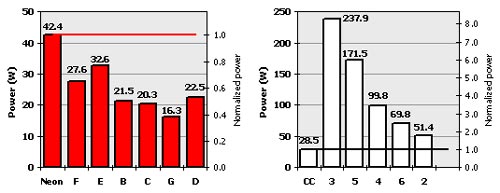
Scaled power of all LED, neon, and cold-cathode signs at equal light output. The left figure compares a reference red neon sign to six red LED signs. The right figure compares a reference white cold-cathode fluorescent sign to five white LED signs.
EXPERIMENT - UNIFORMITY CRITERIA
A human factors experiment was designed to determine criteria that could be used to predict the acceptable brightness uniformity of signs. A sign in the shape of an uppercase character G was divided internally into six sections that were controlled independently to produce three different brightness uniformity patterns. Each pattern had ten equally spaced values of contrast modulation, yielding 30 possible uniformities. Subjects viewed the different uniformities at four distances and two background luminance values. Researchers recorded subjective ratings of the sign uniformities and conditions at which subjects rated the uniformity as not acceptable.
CONCLUSIONS - UNIFORMITY CRITERIA
- Contrast modulation between bright and dark areas within a sign seems to elicit the strongest effect on how people perceive uniformity. For the conditions tested, the effect of contrast seems to be stronger than that of spatial frequency or background luminance.
- Acceptability ratings of brightness uniformity increase with added distance and decrease with added background luminance.
SPONSOR
Connecticut Light and Power
|