|

Optimizing Remote-phosphor LEDs with Optical Ray-tracing
Phosphor-converted LEDs combine a blue LED chip with a “yellow” phosphor adjacent to it to create white light. Newer “remote-phosphor” packages, such as scattered photon extraction (SPE), place the phosphor at a distance from the chip and shape the optic in between, which provides higher light output and longer life than traditional packages.
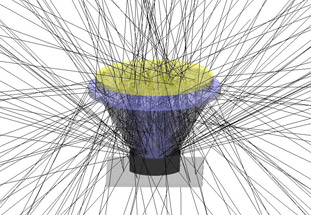
One way to design new LED packages and predict their performance is through optical ray-tracing (Fig. 1). The accuracy of the ray-tracing result depends on the values of the input parameters. One such value is the phosphor’s mean-free-path (MFP), which denotes the average distance that a photon travels between collisions with phosphor particles. This distance affects how much light exits the package. MFP is difficult to determine because it depends on various factors.
EXPERIMENT AND RESULTS
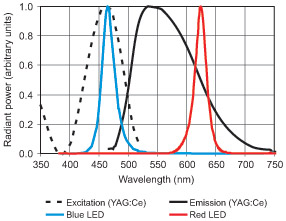
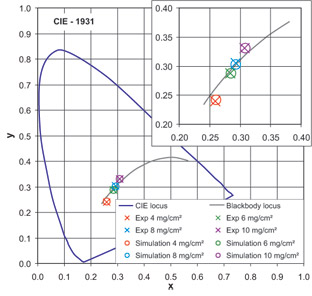
LRC researchers developed a method to determine the MFP of a phosphor layer that can be used in optical ray-tracing analysis to obtain accurate results. In this characterization study, the light output and chromaticity values of an SPE LED package excited by a high-power red LED were compared with those of an optical ray-tracing analysis using LightTools software. The spectral power distribution of the red LED output was not altered by the phosphor medium because it lies outside the excitation spectral range of the YAG:Ce phosphor (Fig. 2). By matching the optical ray-tracing results with the experiment for the transmitted radiant energy to the overall radiant energy ratio, the MFP value was determined. Using this method, the MFP was determined for each of several SPE optics coated with different densities of YAG:Ce phosphor. Next, these lenses were placed on top of a high-power blue LED to excite the phosphor. The experiment results and the optical ray-tracing analysis values for the chromaticity were compared; the two results agreed very well (Fig. 3). This validated the approach taken to measure the MFP of the phosphor layers.
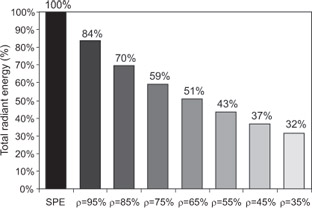
Finally, an optical ray-tracing analysis was conducted to compare results from two types of SPE package: one with transparent side walls for the optics and the other with reflective side walls with different reflectivity values. The SPE package with transparent side walls had much higher light output compared to the reflective side walls (Fig. 4).
PUBLICATIONS
Zhu, Y., and N. Narendran. 2008. Optimizing the performance of remote phosphor LEDs. Journal of Light and Visual Environment 32(2): 115-119.
Full-text PDF 
Project Summary Sheet
SPONSOR
The Link Energy Foundation, Energy Fellowship Program
|