Performance Characteristics of High-Power LEDs
During the last 10 years, LED technology has progressed rapidly from indicator-type lamps producing one to two lumens to high-power, high-flux LEDs with light outputs of 10 to 100 lumens per package. These improvements mean that general illumination using LEDs looks more promising now than ever before.
Manufacturers are producing light fixtures using high-power LEDs. Although these LEDs have improved performance over the previous types, if the light fixtures are not properly designed, the overall performance can be poor. Because of significant differences in performance among the various LED packages and different colored LEDs, a better understanding of how different LEDs perform under different circumstances is important. With this knowledge, LED fixture manufacturers can design more efficient and reliable systems. Therefore, the goal of this study was to investigate the performance characteristics of currently available high-power LED devices under various drive conditions and ambient temperatures.
EXPERIMENT
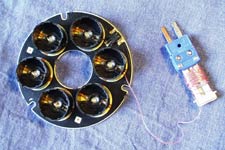
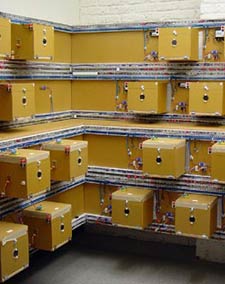
LRC researchers conducted a life-test study exploring the light output depreciation and color shift properties as a function of time for five types of high-power LEDs—red, green, blue, and a single-chip white from one manufacturer, and a multi-chip white from a second manufacturer. Fifteen LED arrays (three of each type) were mounted in specially designed life-test chambers and seasoned for 500 hours, at which time their light output and color properties were measured and recorded. The arrays were returned to their individual chambers and run at two different drive currents and two different ambient temperatures (350 mA and 35°C; 350 mA and 50°C; 450 mA and 35°C). A computer acquisition system gathered data from the chambers every hour. After every 1,000 hours, spectral measurements of each individual LED on the arrays were taken to measure color shift. This study shows the changes in light output and color shift after 2,000 hours.
Figure 1 shows the relative light output change as a function of time for each LED type tested.
Figure 2 shows the CIE x,y values of the individual white LEDs after 0, 1,000, and 2,000 hours.
CONCLUSIONS
- The green and white LED devices from the first manufacturer showed very little light loss after 2,000 hours, even under increased current and ambient temperature. Overall, the red LEDs had a high degradation rate.
- Although the degradation rate appeared to increase with increasing junction temperature for most of the LEDs, it is too early to generalize.
- For a given junction temperature, the degradation rate is different for different types of LEDs.
- The white LEDs showed significant color variations between each individual LED, but the color shift over time was very small. Color variation will need to improve in order for white LEDs to be accepted broadly for general illumination applications.
SPONSOR
U.S. Department of Energy, DOE Grant #DE-FC26-01NT41203 and the University of California at Santa Barbara
|