How to Perform Economic Calculations
Use the lighting calculator included on the lighting pattern pages to compare the base case of a design with the improved lighting design shown on that page. The base case design represents the typical existing lighting system, while the improved case represents the lighting system being considered. The default values that appear in the calculator are typical of the lighting equipment in the designs, but these values can be replaced to represent a particular lighting system.
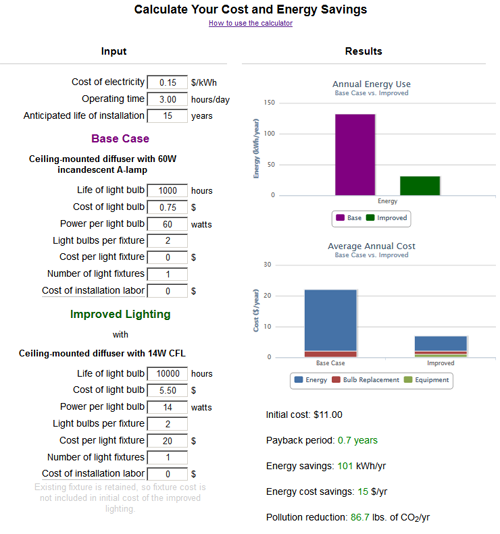
How to use the Lighting Calculator
User Inputs
Cost of electricity in dollars per kilowatt hour ($/kWh): This can be found on the utility bill, and is typically between $0.10-0.20/kWh. Some utilities have seasonal rates that can be averaged to calculate an annual rate.
Operating time: Estimated number of hours per day during which the base case light installation is turned on.
Anticipated life of installation: Estimated number of years the improved lighting installation is expected to be maintained before the light fixtures will be replaced.
Life of light bulb: The average rated life of the light bulb, in hours, as stated by the manufacturer. This information can be found on the light bulb packaging. (For incandescent and fluorescent bulbs, this number indicates the number of hours when 50% of a large group of bulbs have failed. For LEDs, it represents the time that the manufacturer estimates it will take for the light output to decrease by 30% from the initial amount.) to Life of light bulb: The average rated life of the light bulb, in hours, as stated by the manufacturer. This information can be found on the light bulb packaging. This value is based on an average from a large sample of the products. See the "Life" section in the guide "How to Select Bulbs and Fixtures" for more information.
Cost of light bulb: Cost of one light bulb, in dollars. Default values are based on buying one product, so higher-quantity pricing may be lower.
Power per light bulb: Power demand of one light bulb, in watts. This value can be found on the light bulb packaging.
Number of light bulbs: The number of light bulbs per fixture. For example, if the bulb will be installed in a chandelier with five sockets, enter "5" here.
Cost per light fixture: Price of the new light fixture, including the initial bulb(s) if required. Default values are based on buying one product, and higher-quantity pricing may be lower.
Number of light fixtures: The number of a particular type of light fixture used in the installation.
Cost of installation labor: This optional cost accounts for any installation labor by electricians, carpenters, or other contractors. Because labor costs are highly dependent on the construction of the building and other variables, the default value is always $0. This cost can be estimated by contacting the contractor(s) for a quote, as needed. If the homeowner is doing the work, this cost can remain as $0.
Cost of control: The cost of lighting controls (i.e., dimmers, occupancy sensors, etc.) used in the installation.
Dimming power: This represents the fraction of the full power demand of the fixture when it is dimmed or switched off, between 0 and 1. For example, if a manual dimmer switch is used and the occupant typically dims the power to three quarters of full power, then the dimming power value would be 0.75. If a vacancy sensor is used to switch the fixture off, then the dimming power would be 0.
Fraction of time dimmed: Estimated fraction of the time during which the dimmer or control is expected to be in use. Zero indicates the control is never active, while 1 indicates that the control is always active. Intermediate values are appropriate for most applications. For example, 0.3 indicates the control will dim or switch off the light (depending on the dimming power) 30% of the light's operating hours.
Life of fixture: For an integrated LED fixture that does not have a replaceable bulb, use the manufacturer rated life.
Power per fixture: For an integrated LED fixture that does not have a replaceable bulb, the power demand in watts.
Understanding the Results
Annual energy use (kWh/year): The amount of energy that all lighting components in a design will use in one year (in kilowatt hours per year, or kWh/year). This is based on the power demand and time of use of the fixtures. The lighting calculator will compare the annual energy use for the base case and the improved design.
Annual average cost of ownership ($/year): The average cost of owning and maintaining a lighting installation for one year. This is calculated as the total costs of equipment, electricity, light bulb replacements, and installation labor, divided by the anticipated maintained life of the lighting system. The results are subdivided into the annual average costs of electricity, bulb replacements, and initial equipment costs, including labor.
Initial cost: This includes the up-front cost of equipment (fixtures and controls) and any labor entered by the user for the improved lighting case. Initial cost is not calculated for the base case because this lighting is assumed to already be installed. The fixture cost includes any initial bulbs needed.
Payback period: The initial cost of the improved lighting divided by the annual electricy and replacement bulb savings of the improved lighting compared to the base case. This yields the number of years it would take to achieve a return on the investment of an installation. This is a simple payback calculation and does not take into account the time value of money. If "Payback not achieved" is shown, then the payback period is longer than the anticipated life of installation, so the design is not cost-effective. Depending upon the design goals, this result is not necessarily undesirable. For example, someone might decide that a lighting design that saves energy or provides improved lighting quality but does not provide monetary payback is still worth installing.
Energy savings: This is calculated by subtracting the energy use of the base case from the energy use of the improved lighting design, in kWh/year. Results shown in green indicate a reduction in energy while results shown in red indicate an increase in energy use.
Energy cost savings: This is the cost savings from energy use reduction, calculated as the energy savings times the cost of electricity.
Pollution reduction: Pollution reduction, in pounds of carbon dioxide per year, is based on the average rate of carbon dioxide emissions per kilowatt hour in New York State. Results shown in green indicate a reduction in pollution while results shown in red indicate an increase in pollution.
Lighting Calculator Tips
- The calculator starts with suggested values in all input fields except for the installation labor. These values can be modified by the user by deleting the number and then typing in a new one in order to reflect a particular base case and improved lighting design.
- The lighting calculator assumes that all lights in an installation remain on for the number of operating hours listed, even though in actuality different lights are used at different times. This can lead to results showing lower energy and cost savings than might actually be achieved.
- If a lighting design contains many different fixtures, but the desired calculation is for the performance of one specific fixture, then isolate it by entering the numeral zero for the number of the other light fixtures.
- Some lighting patterns will not save energy. Reasons for this include:
- The lighting calculator assumes that all lights in an installation remain on for the number of operating hours listed. In practice, some of the lights will often be used while others are off, therefore saving energy.
- Depending upon design goals, this result is not necessarily undesirable. For example, a lighting design may not save energy, but may result in higher quality of lighting. For situations where safety or task lighting is desired, quality of light may be a higher priority than energy savings. Look at the total lumens to compare the amount of light produced by the base case and the design alternative.
Economics and Energy Tips
- Dimmers can be used to save energy; however, the energy savings from dimming are relatively small compared with the possible energy savings from switching from incandescent bulbs to LEDs or CFLs.
- Although most homeowners do not pay labor costs for bulb replacement, managers of some large facilities may reduce bulb replacement labor costs through the use of longer-life bulbs, or through reduced hours of operation due to automatic lighting controls.
- If the goal is to save money, start by replacing the lights that are on for long periods of time and use the most power. In most homes, this means first replacing the primary lights in the kitchen, living room, and dining room. The table below shows the average number of hours that lights are on in a room.
| Hours Per Day That Lights Are On (Assumed) | |
|---|---|
| Room | Hours Per Day |
| Kitchen | 3 |
| Living Room | 3 |
| Dining Room | 3 |
| Basement | 2.5 |
| Home Office | 2 |
| Bathroom | 1.5 |
| Garage | 1.5 |
| Entry, Foyer, or Mudroom (Single-Family) | 1.5 |
| Hallway (Single-Family) | 1.5 |
| Laundry Room | 1.5 |
| Bedroom | 1 |
| Closet | 1 |
| Night light | 12 |
| Multi-Family | |
| Hall (Multi-Family) | 24 |
| Entry (Multi-Family) | 24 |
| Stair (Multi-Family) | 24 |
| Exteriors | |
| Exterior (Single-Family) | 4 |
| Exterior, with dusk-to-dawn controller | 3 |
| Exterior, with dusk-to-dawn and motion detector controllers | 2.5 |