Introduction to the Application Help Menu

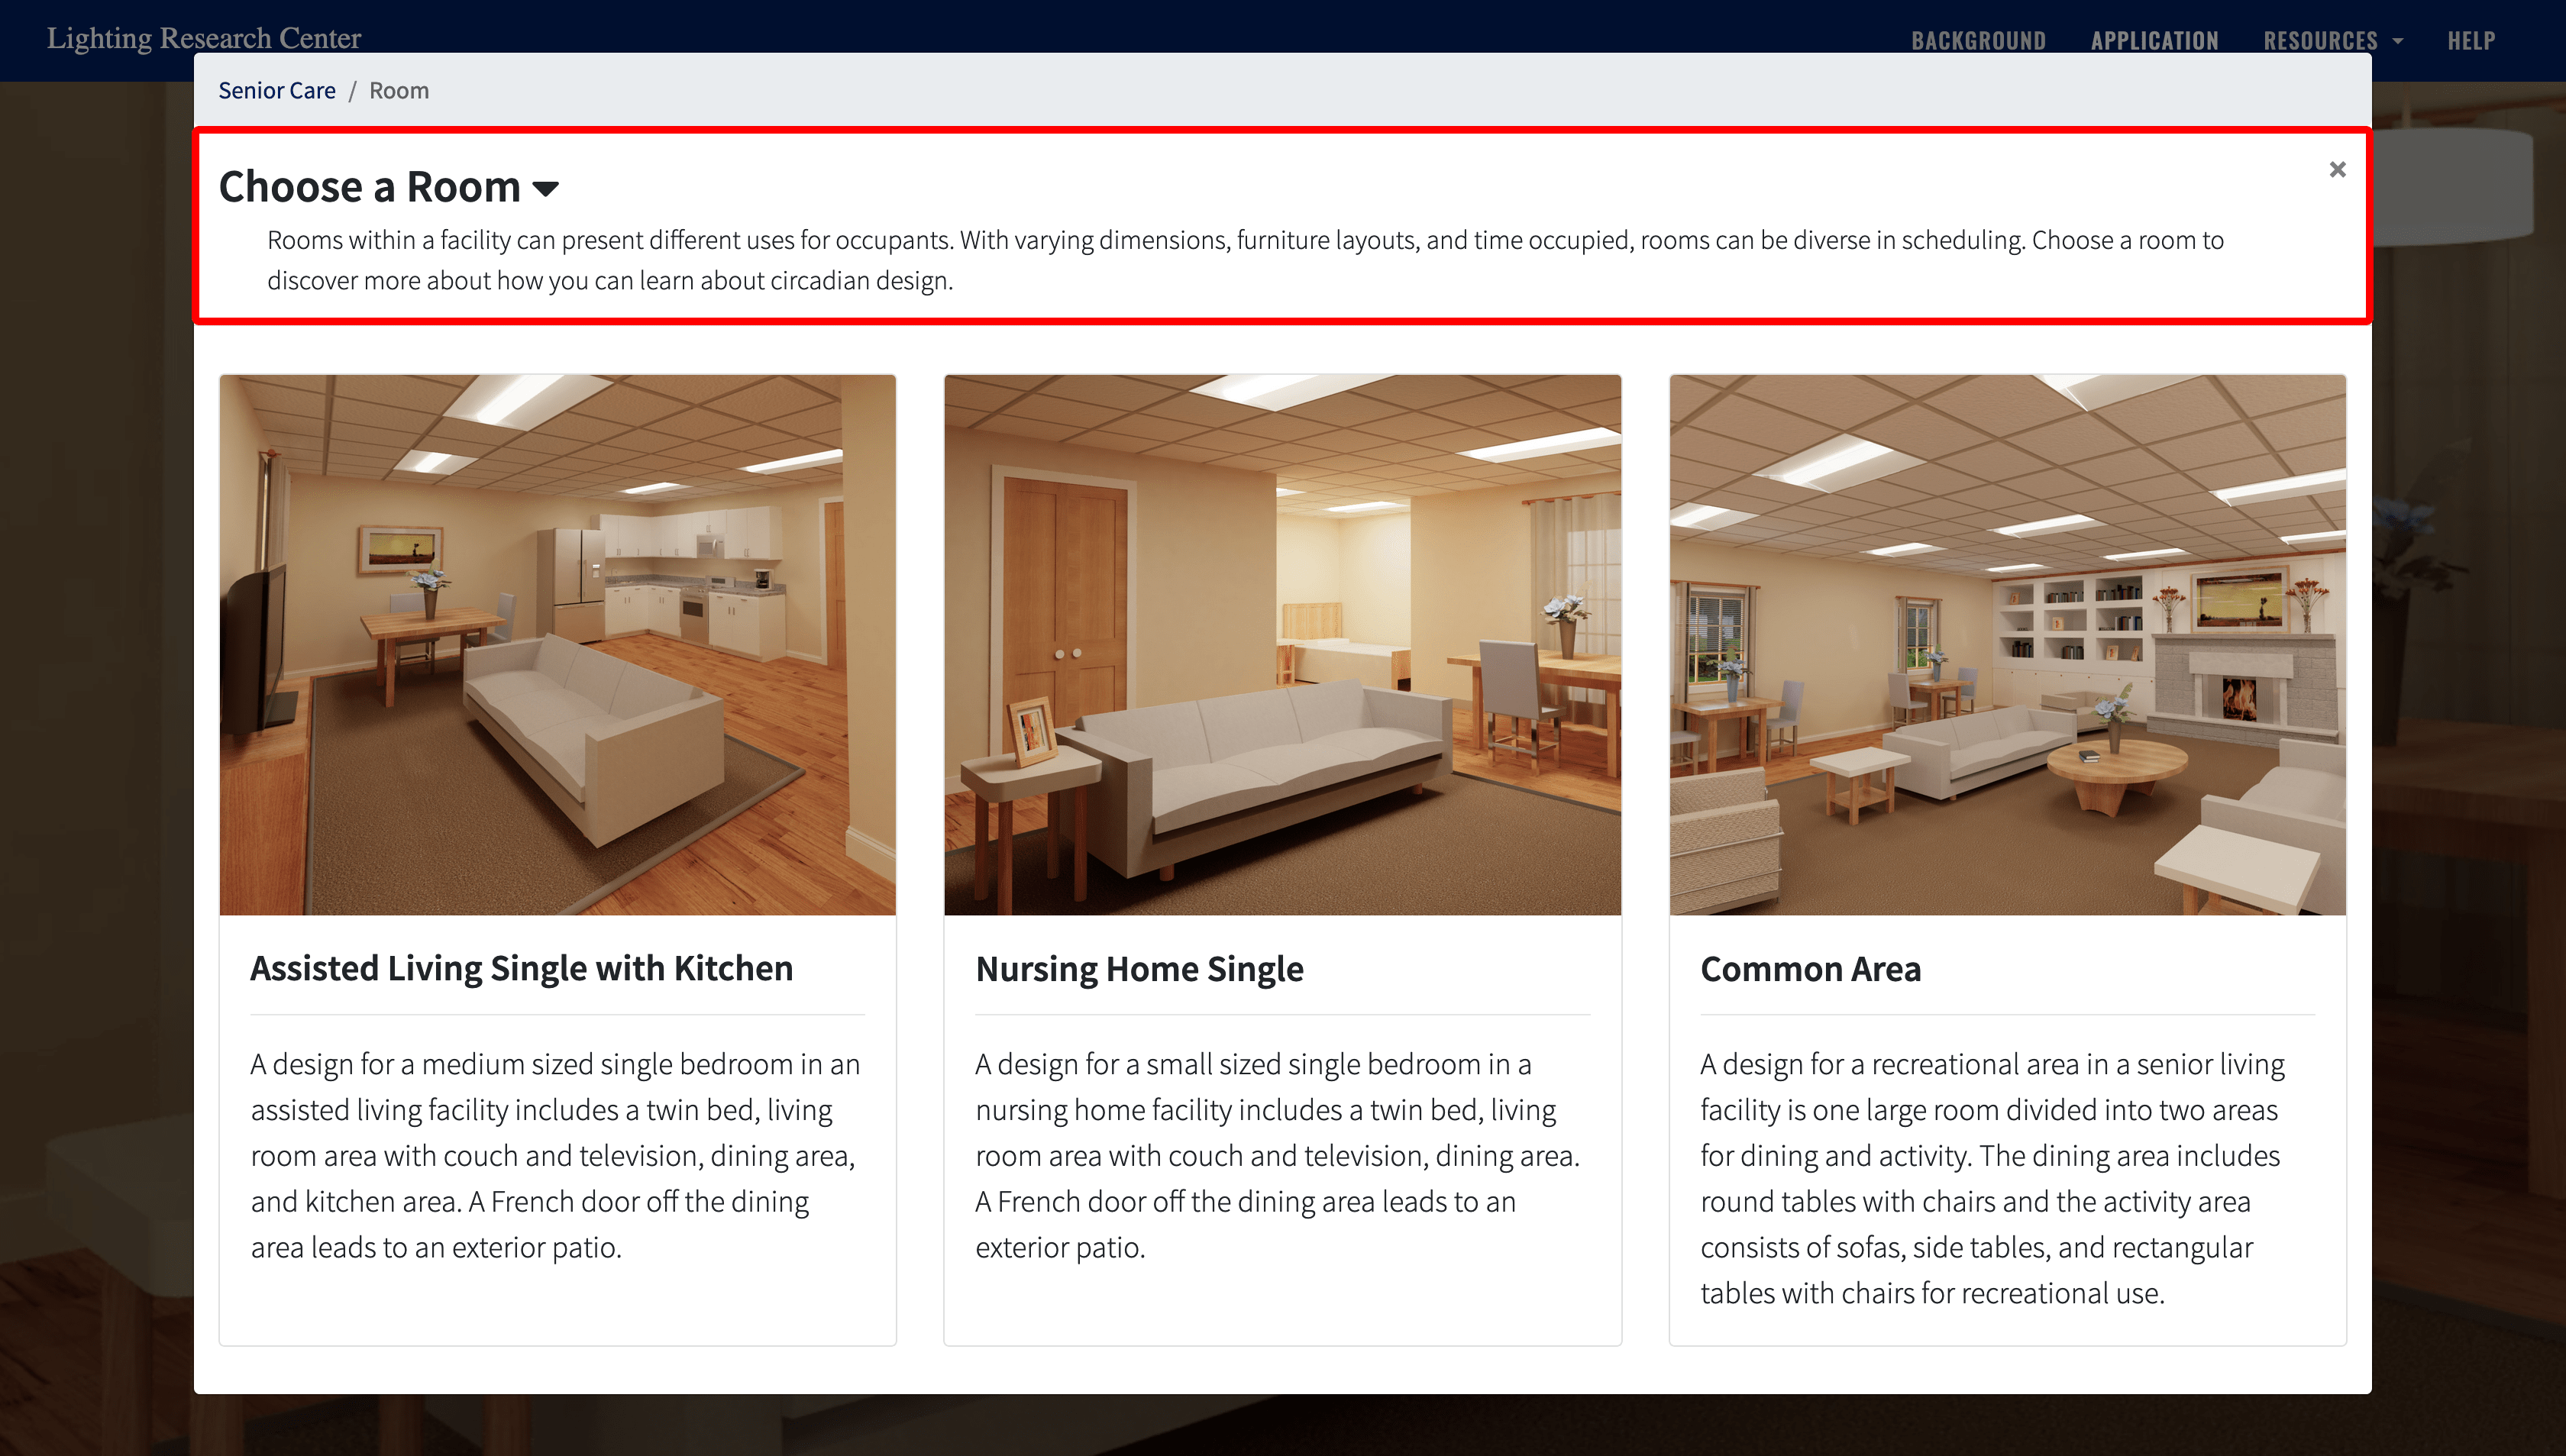
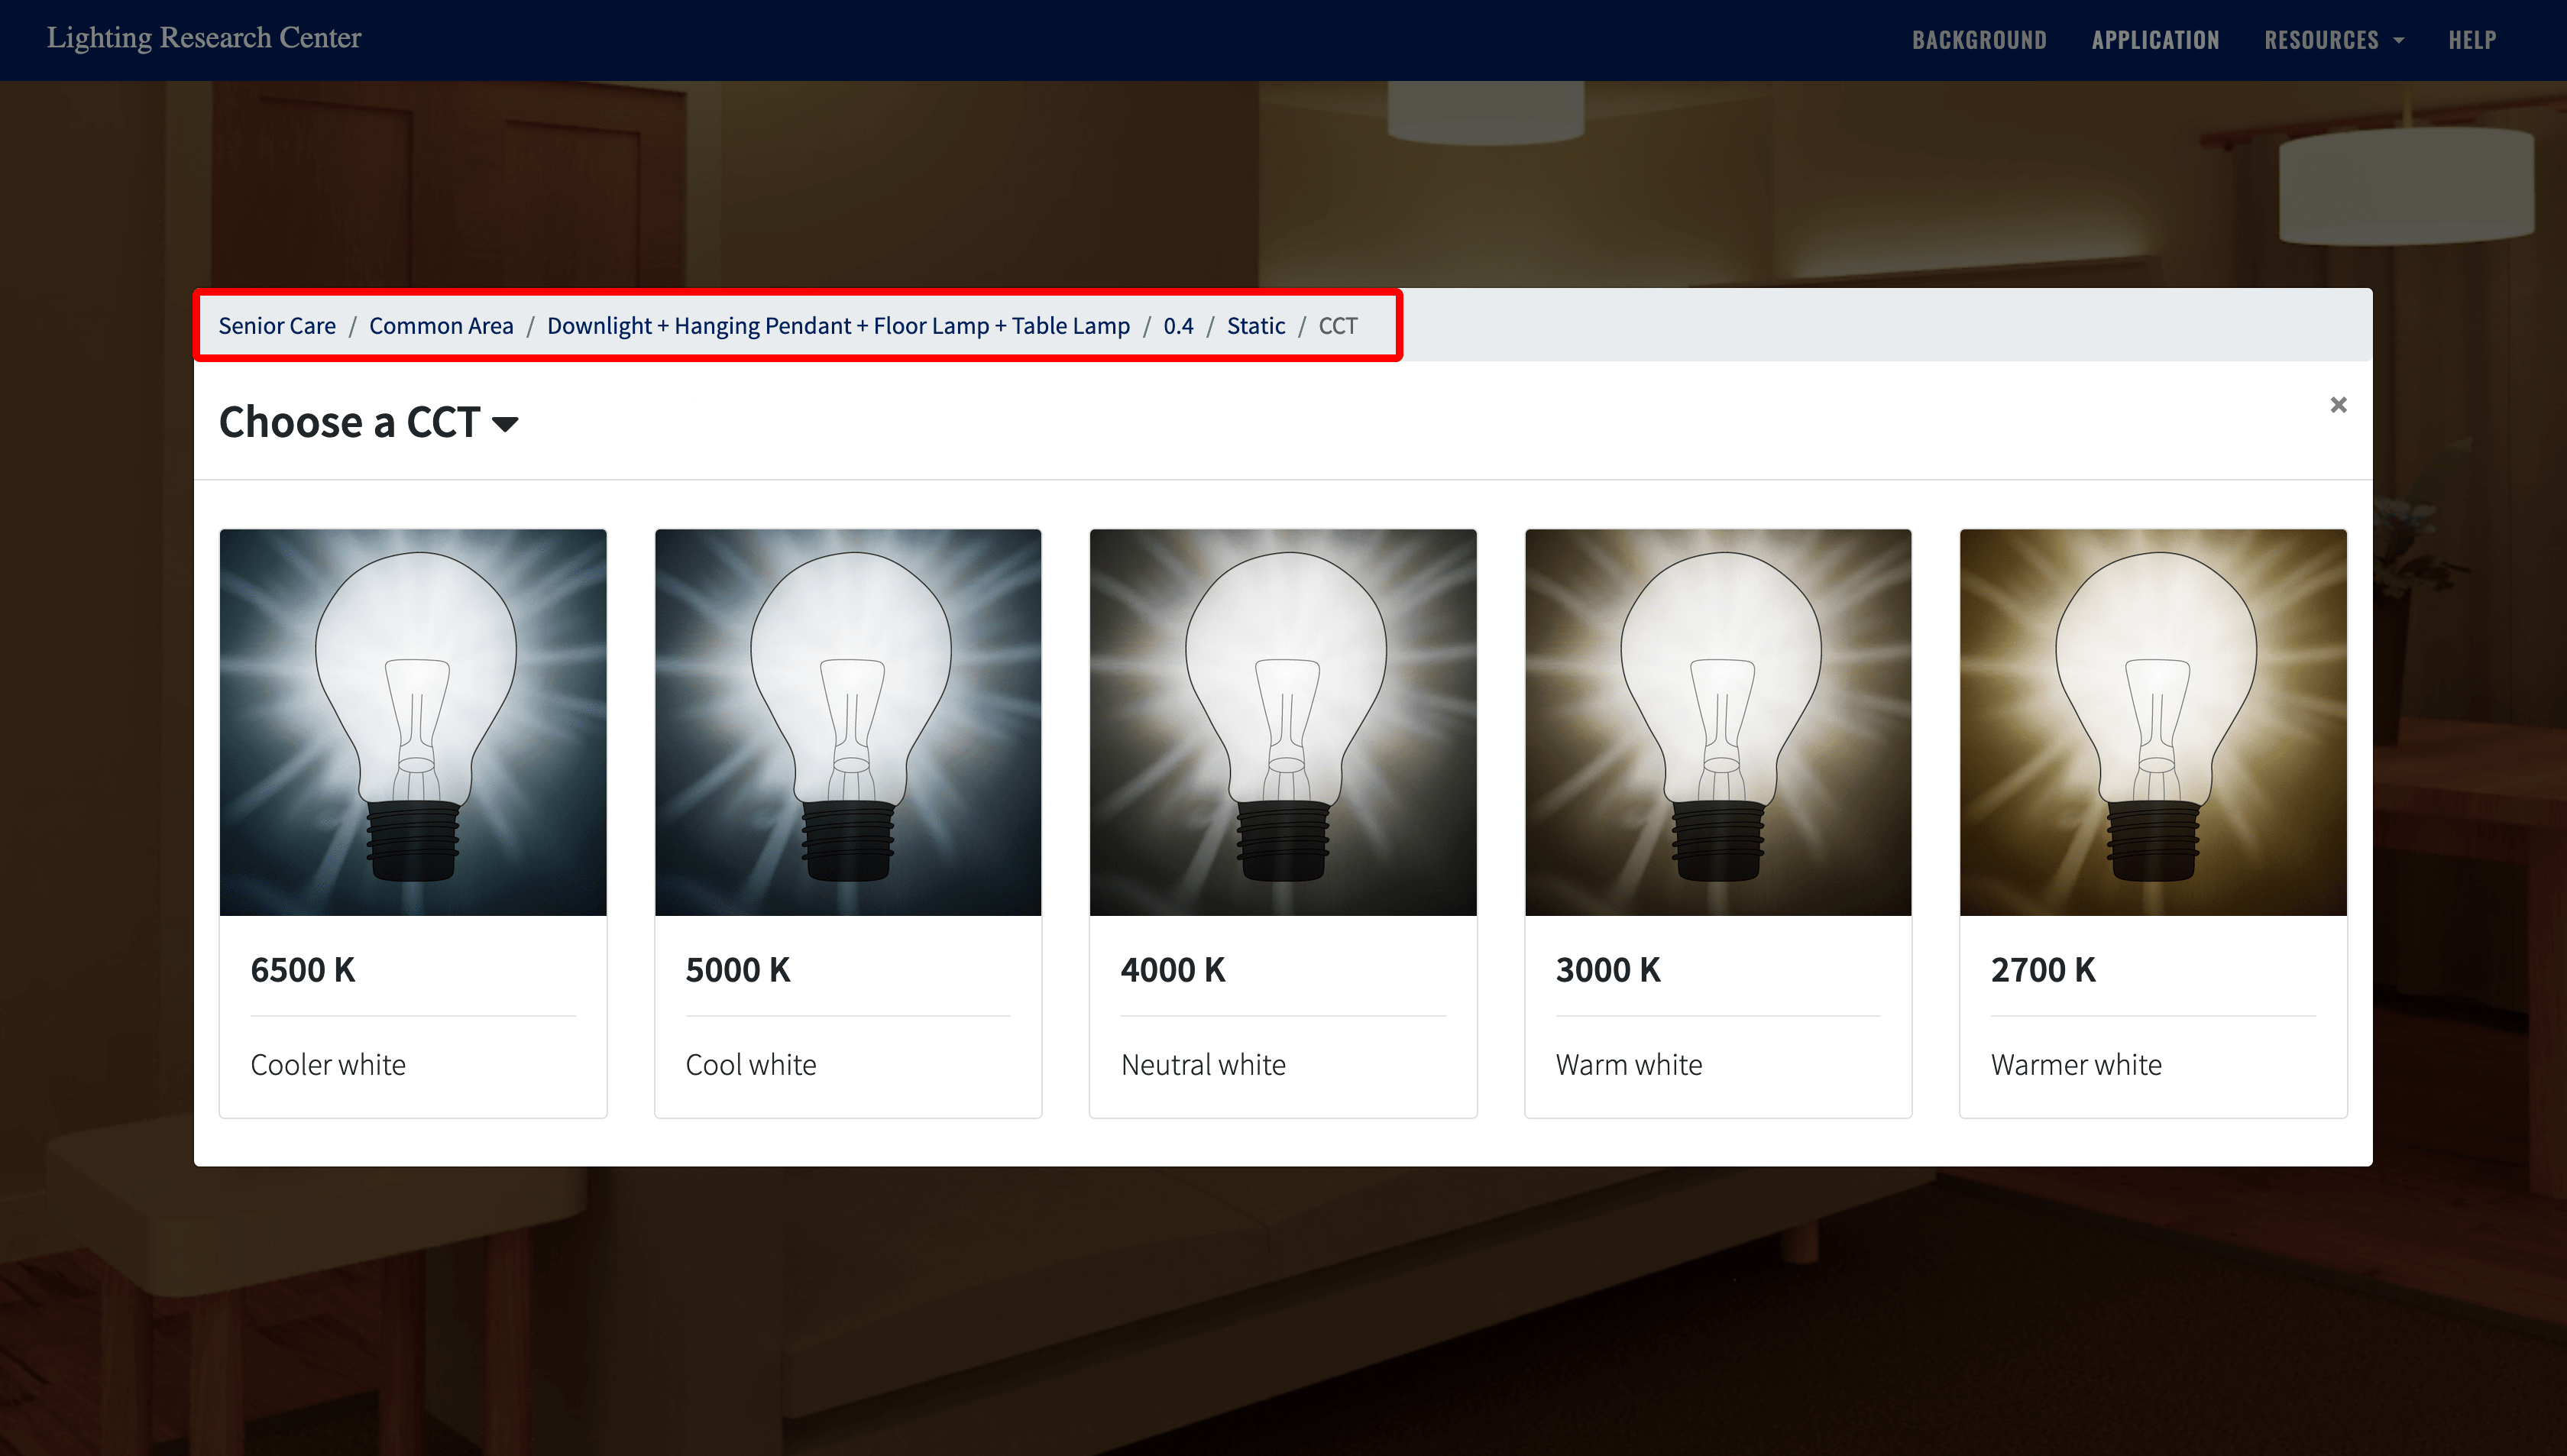
Selection Process

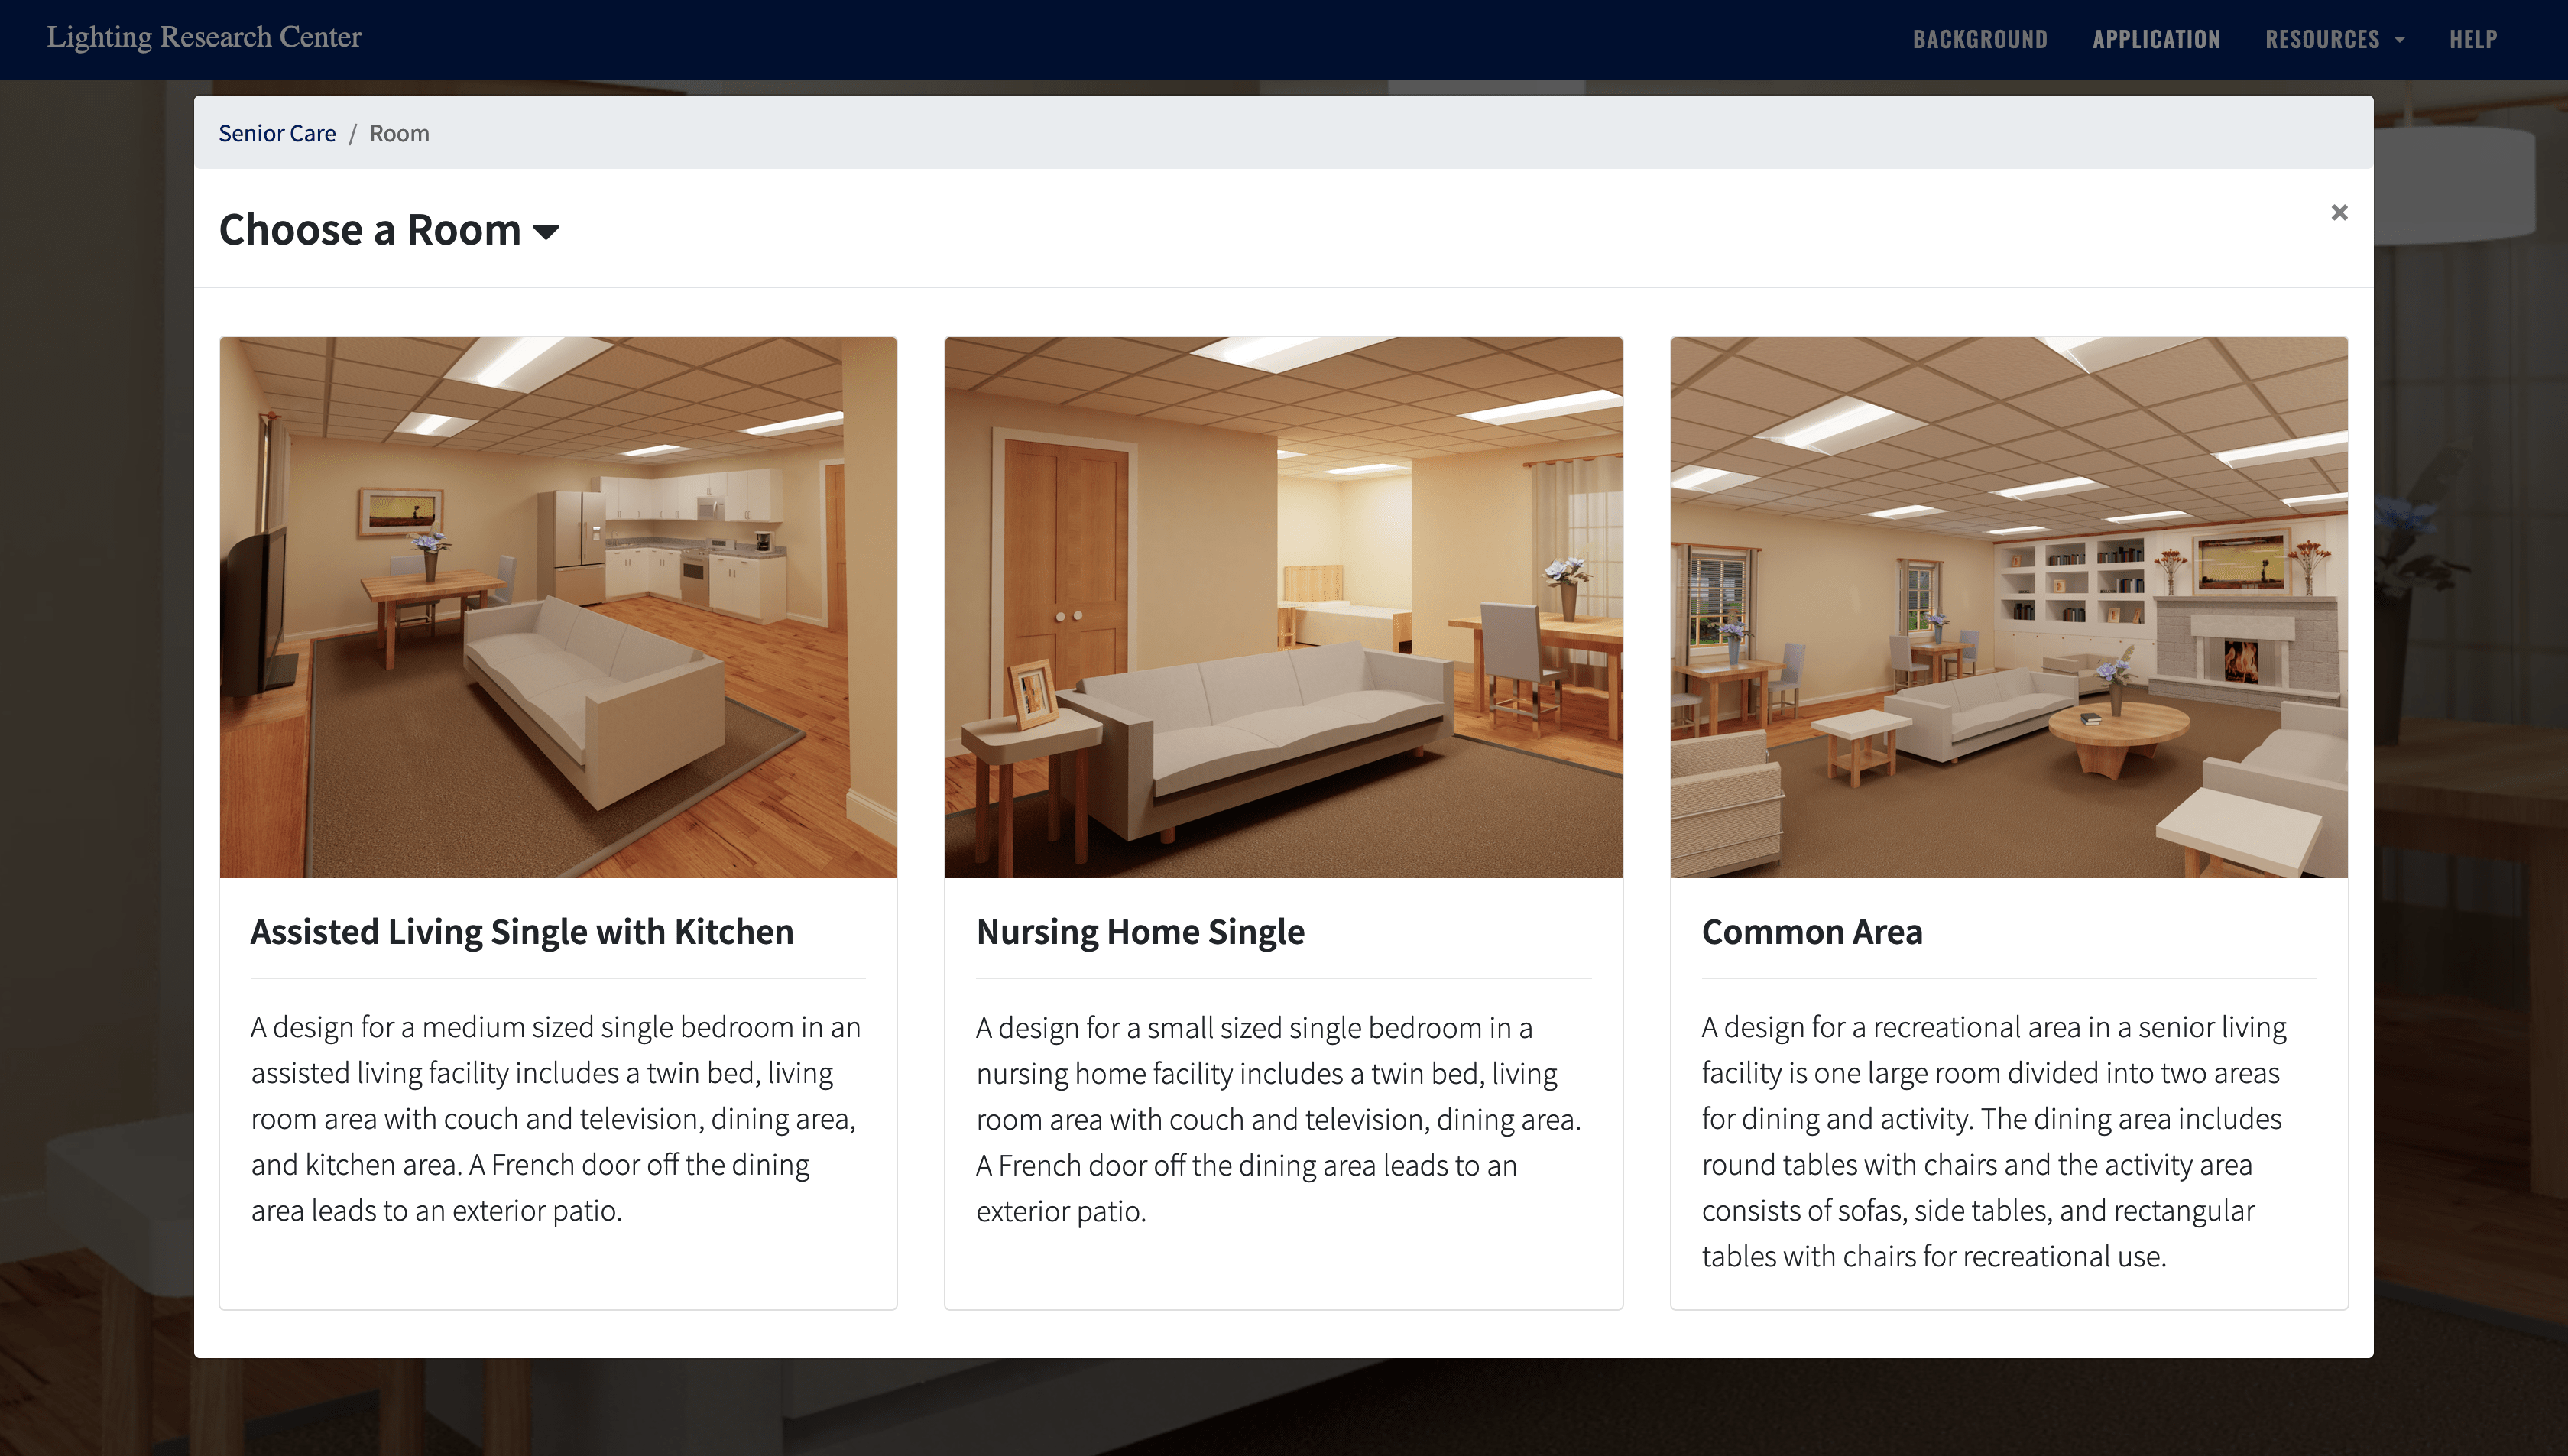
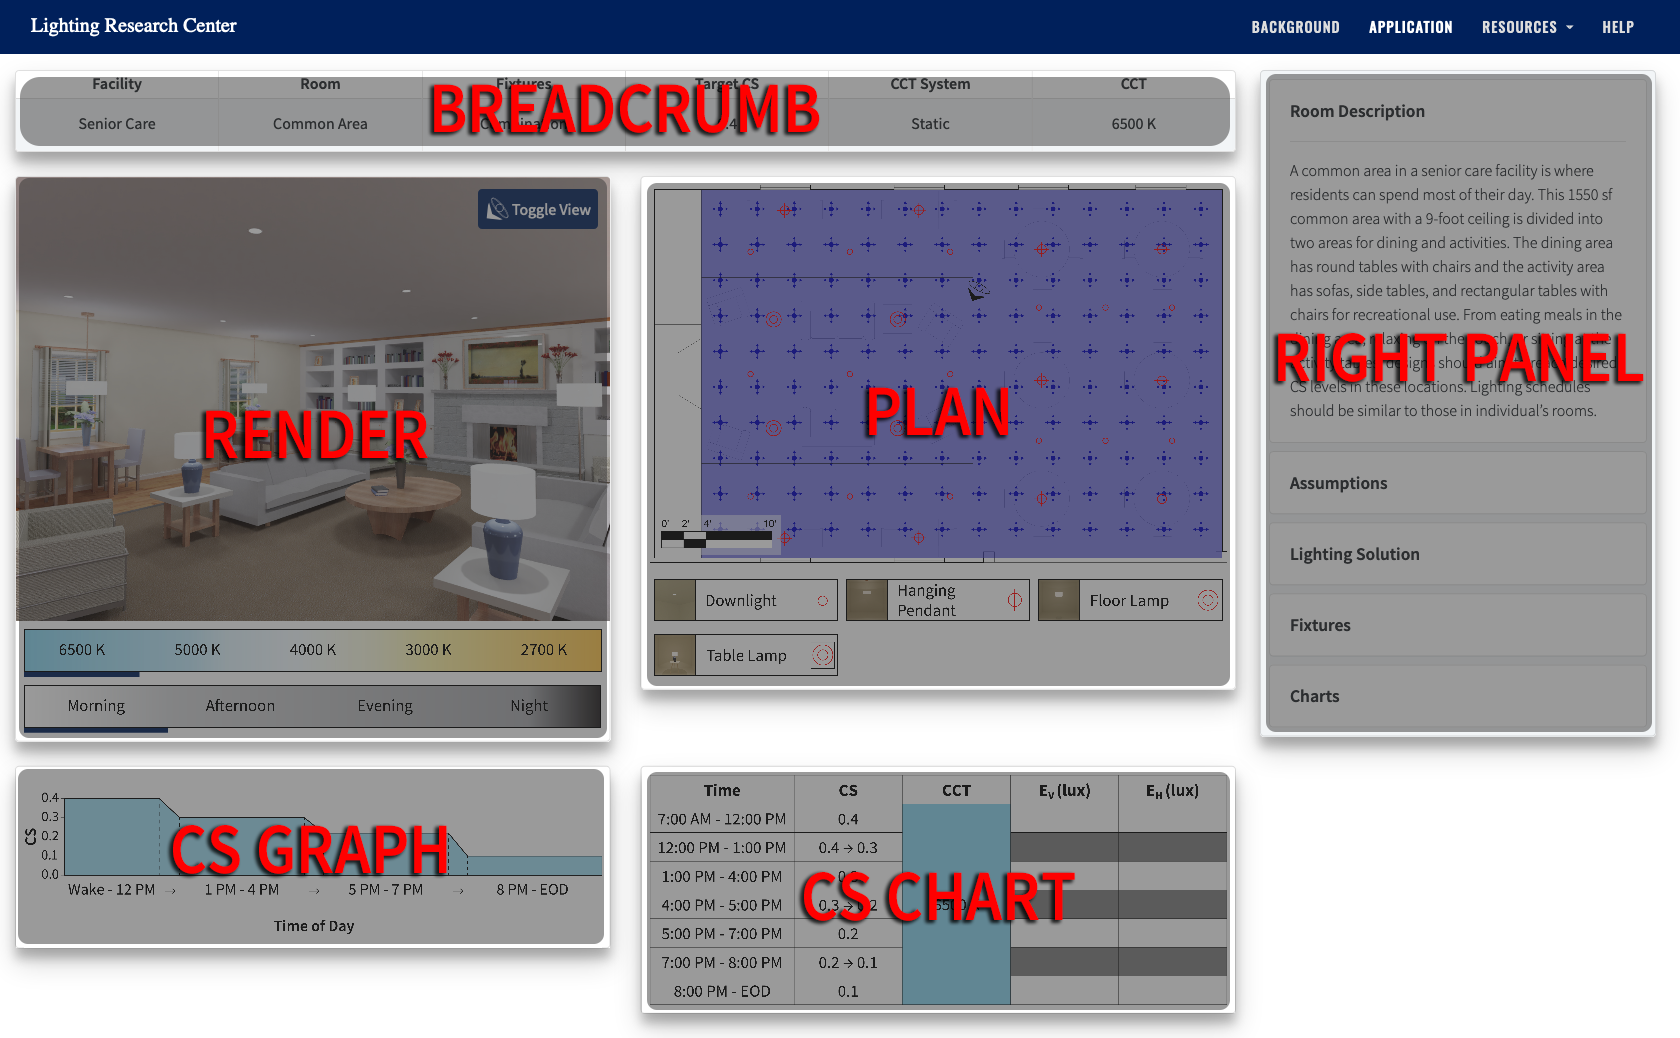
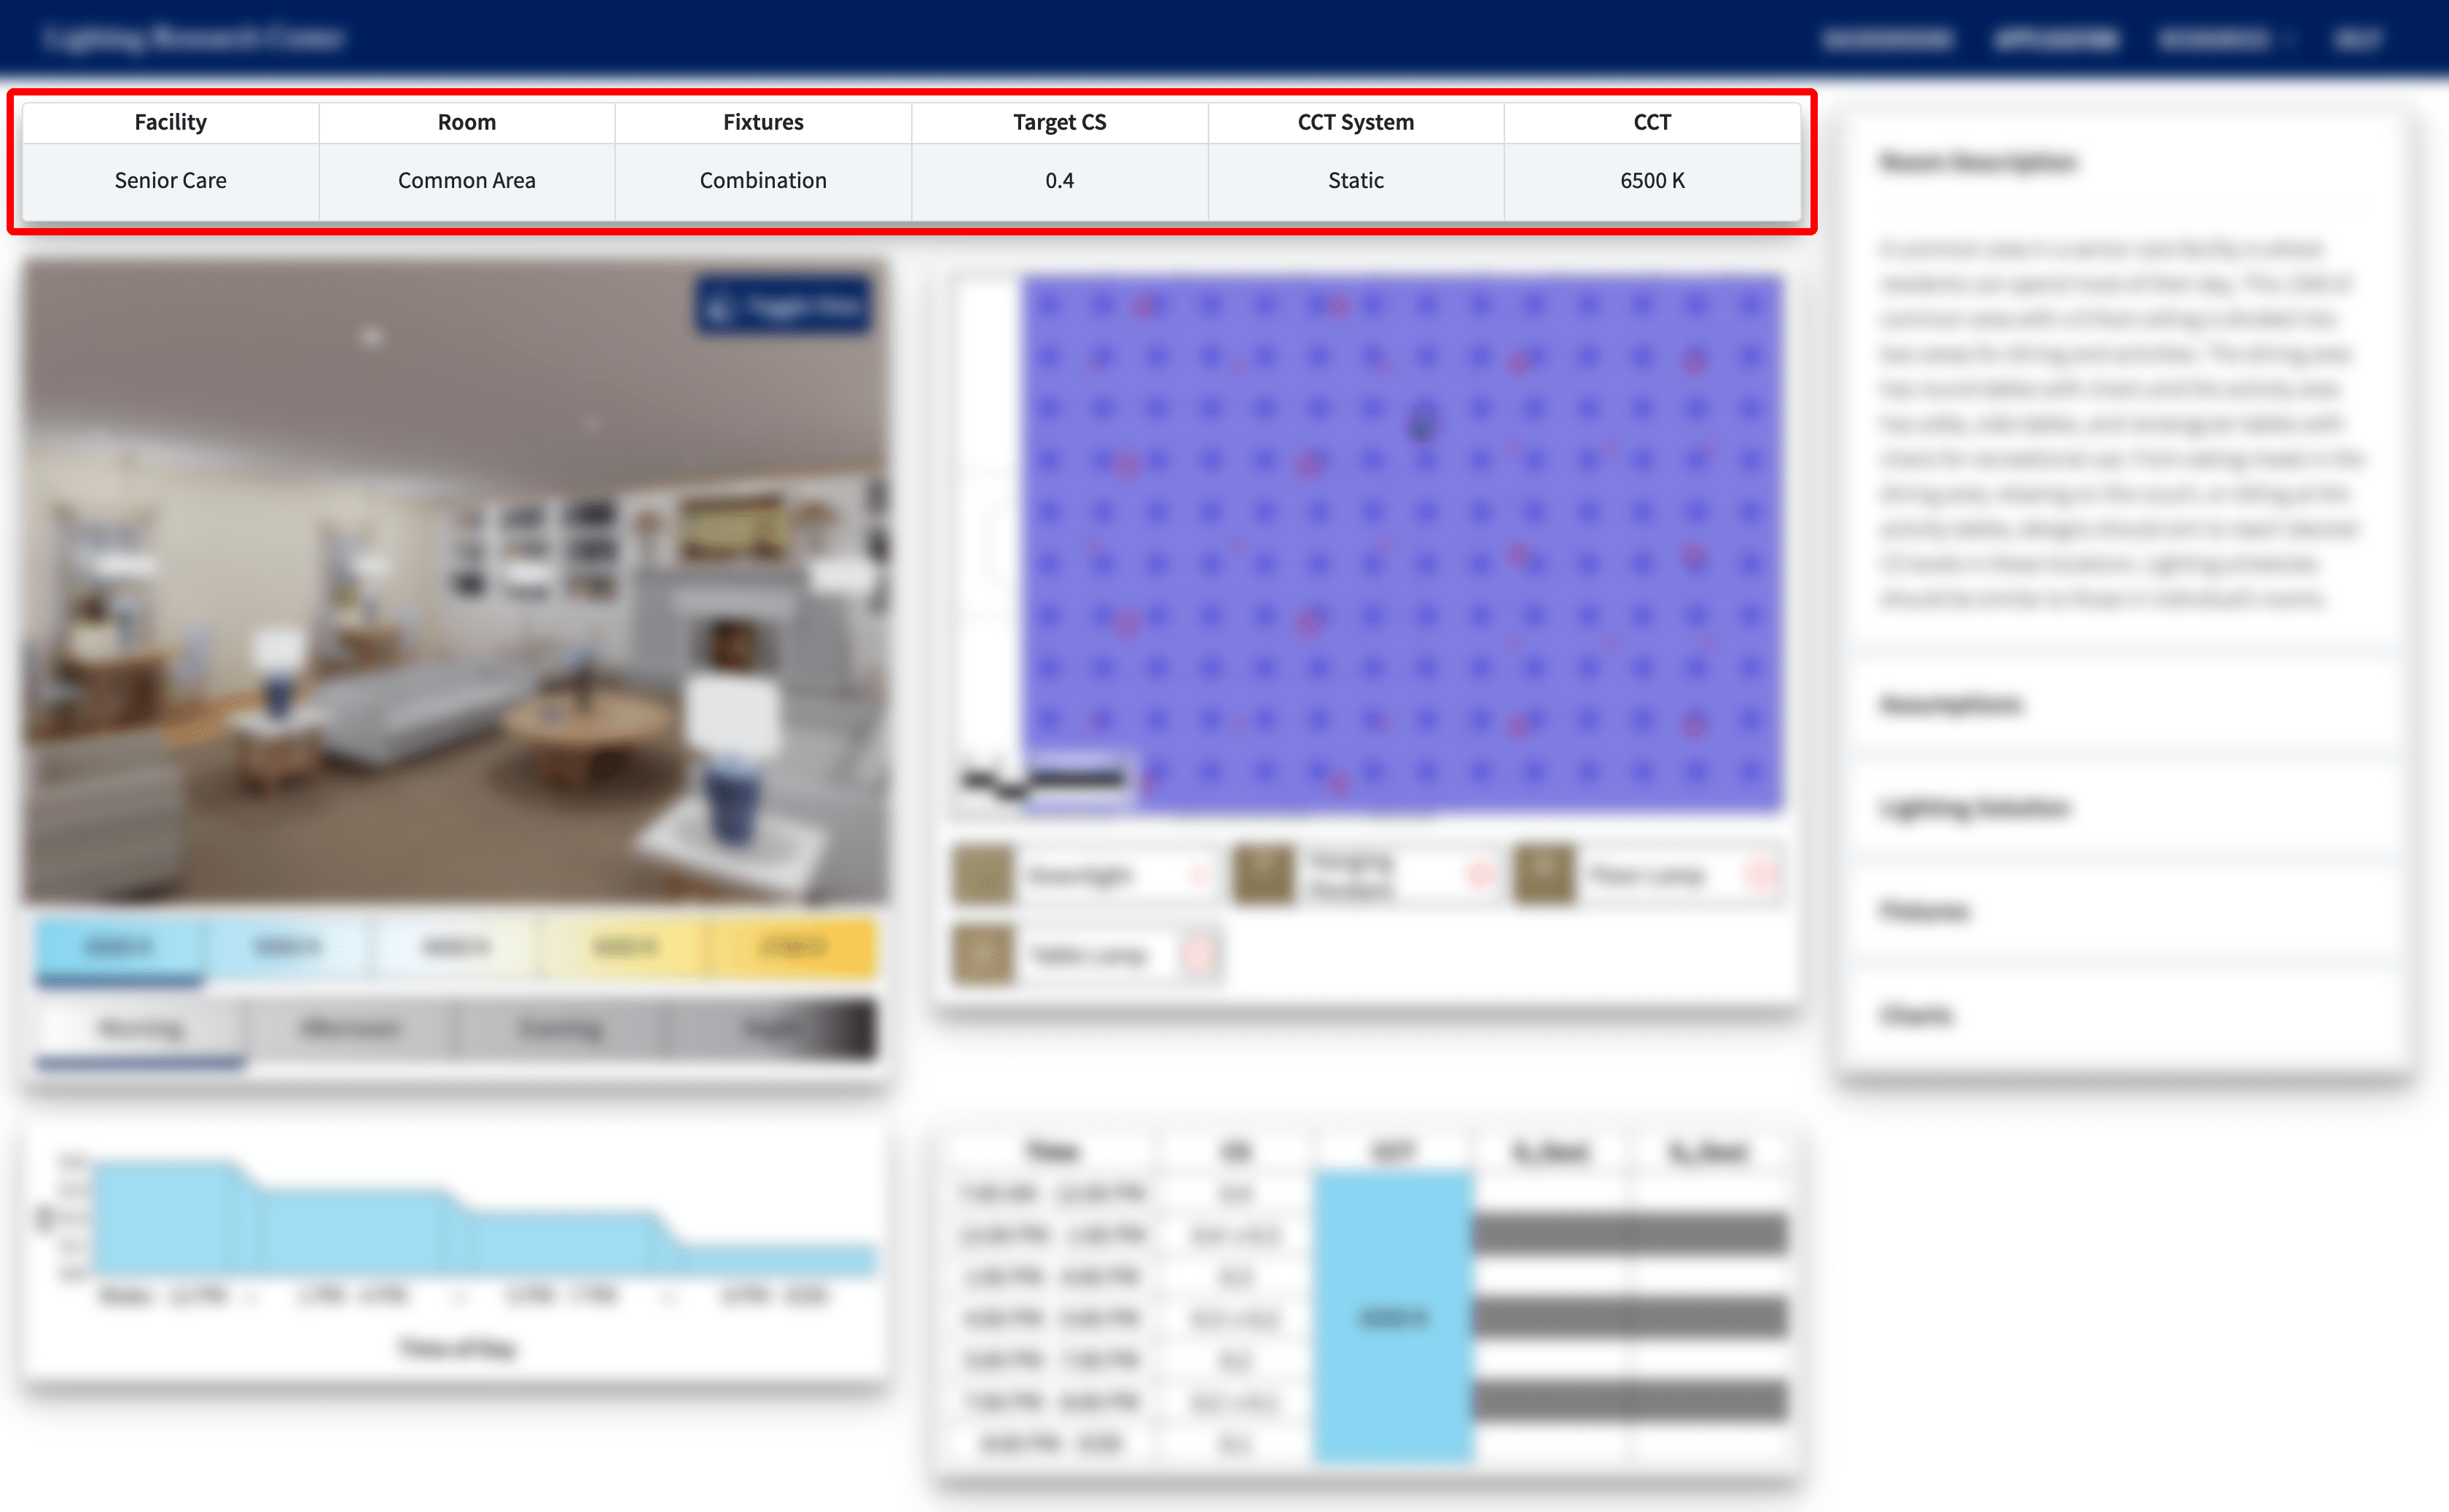
Breadcrumb


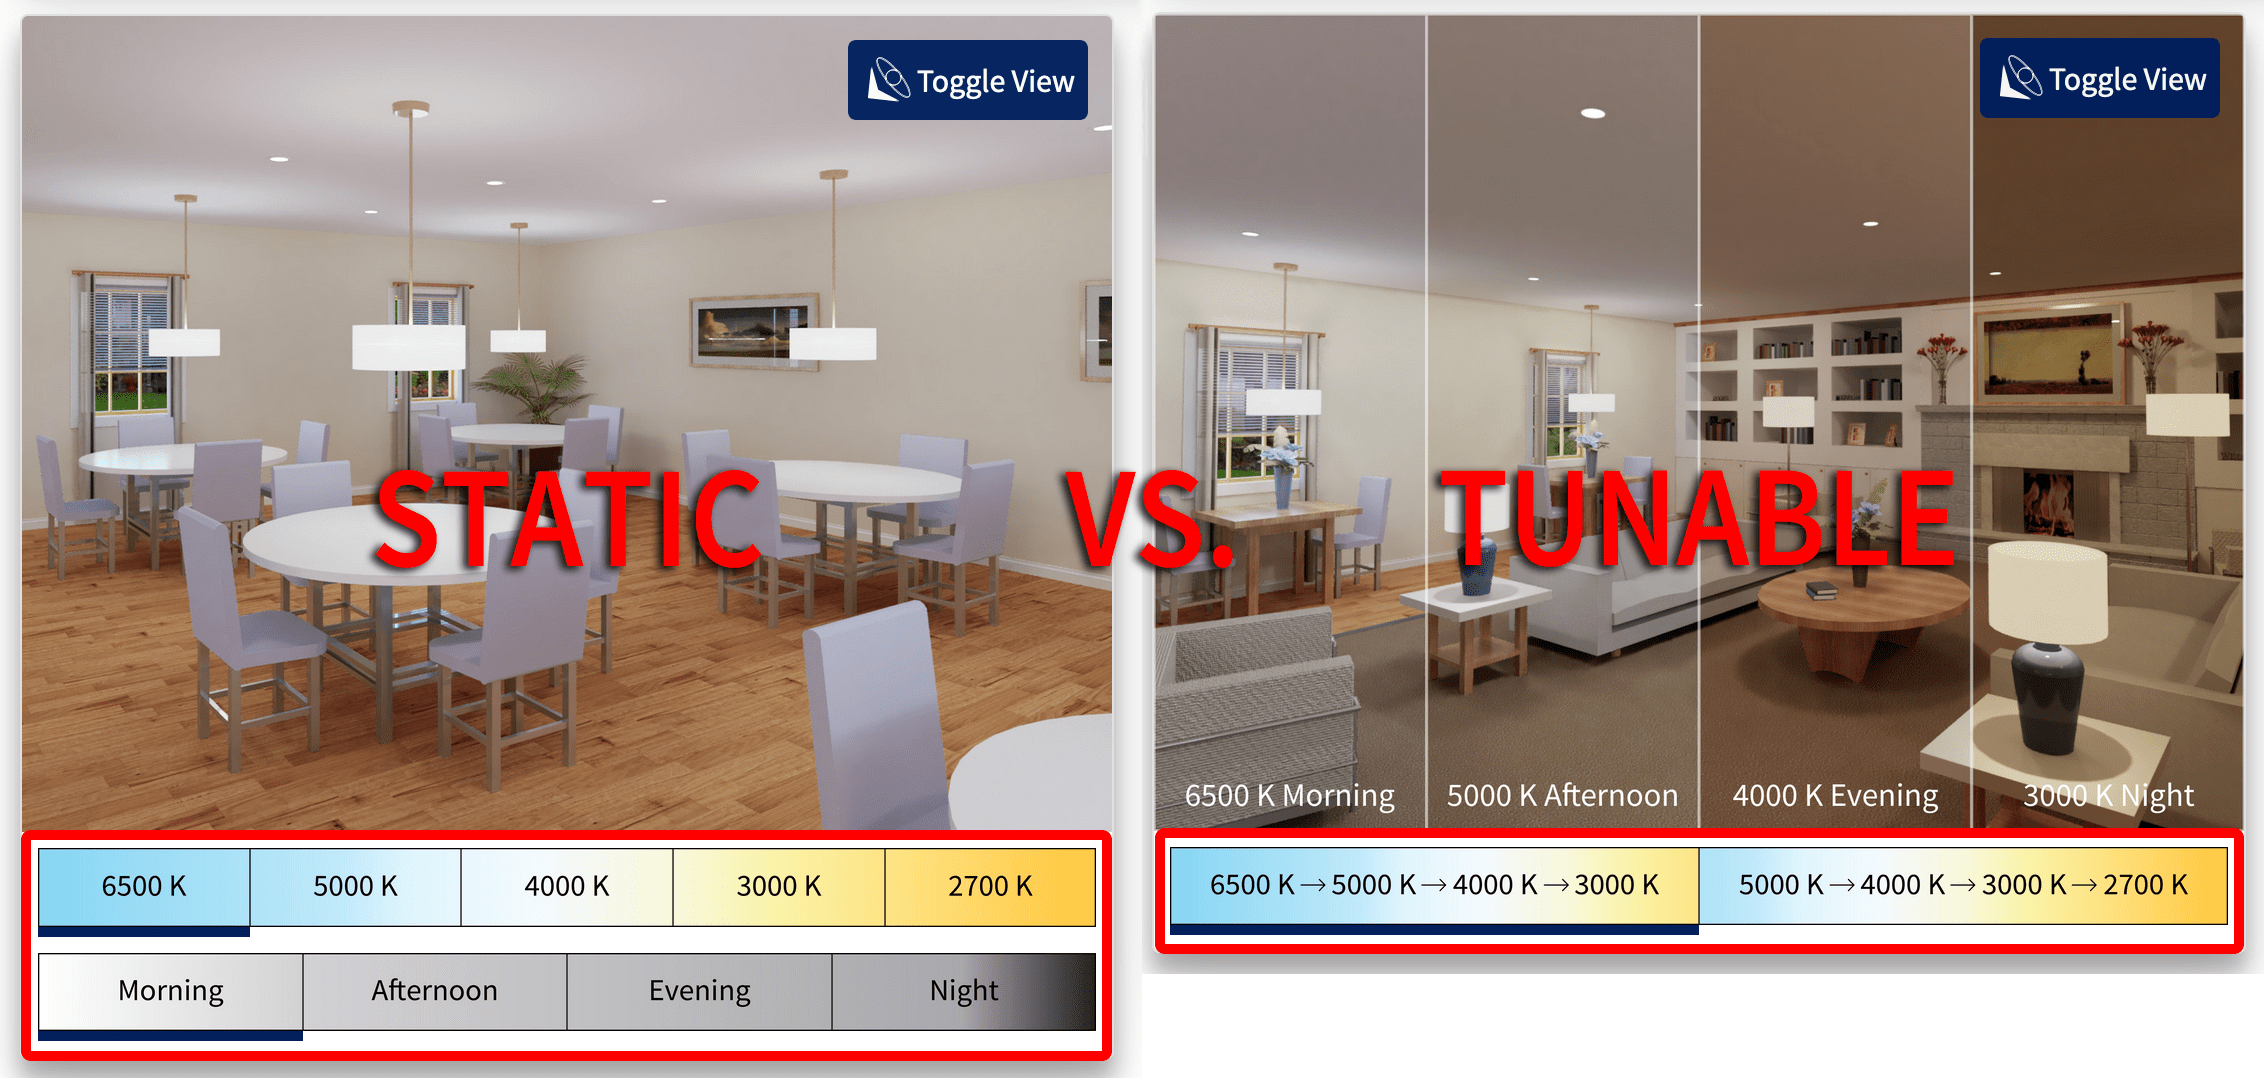
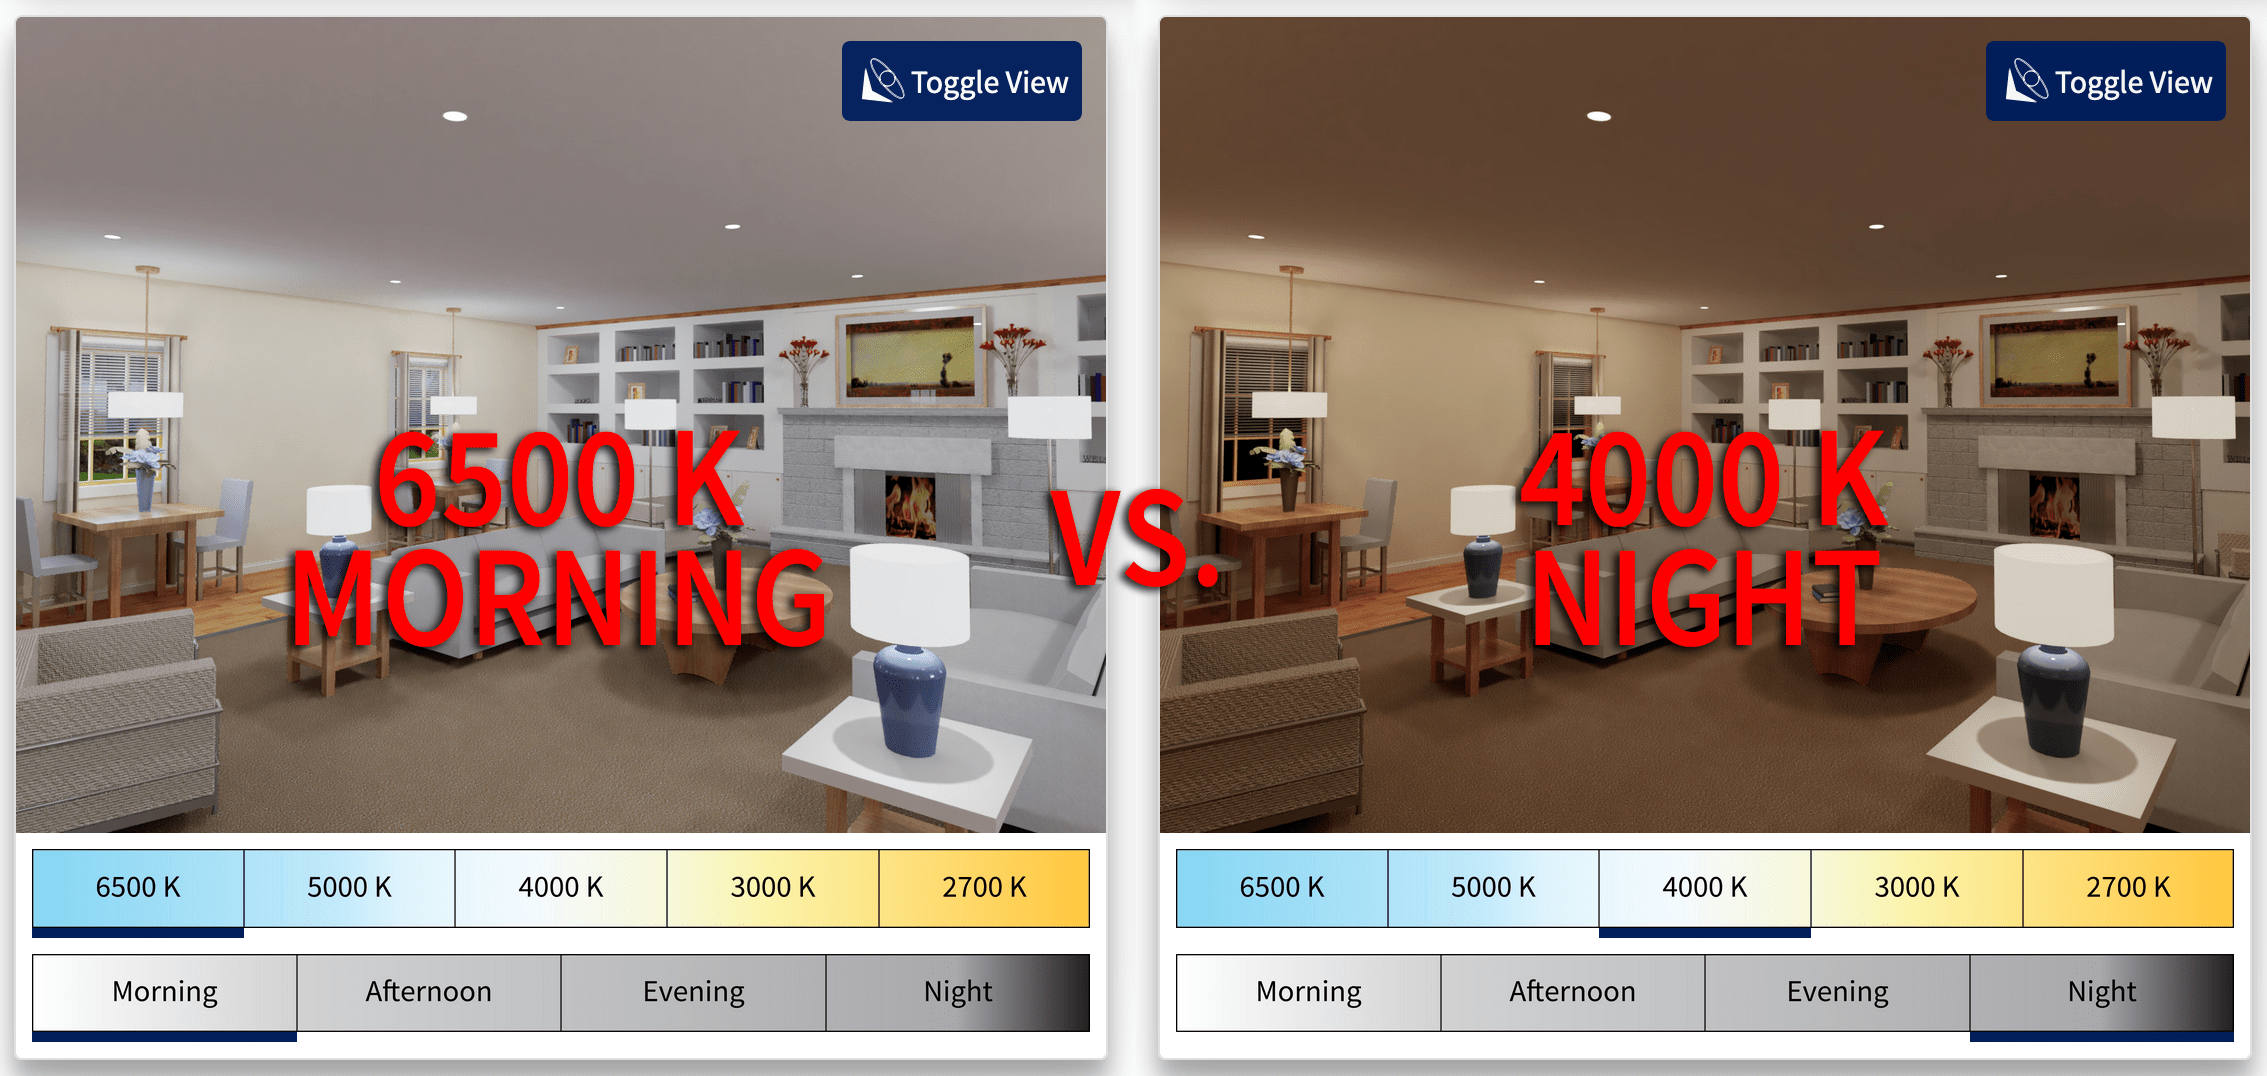
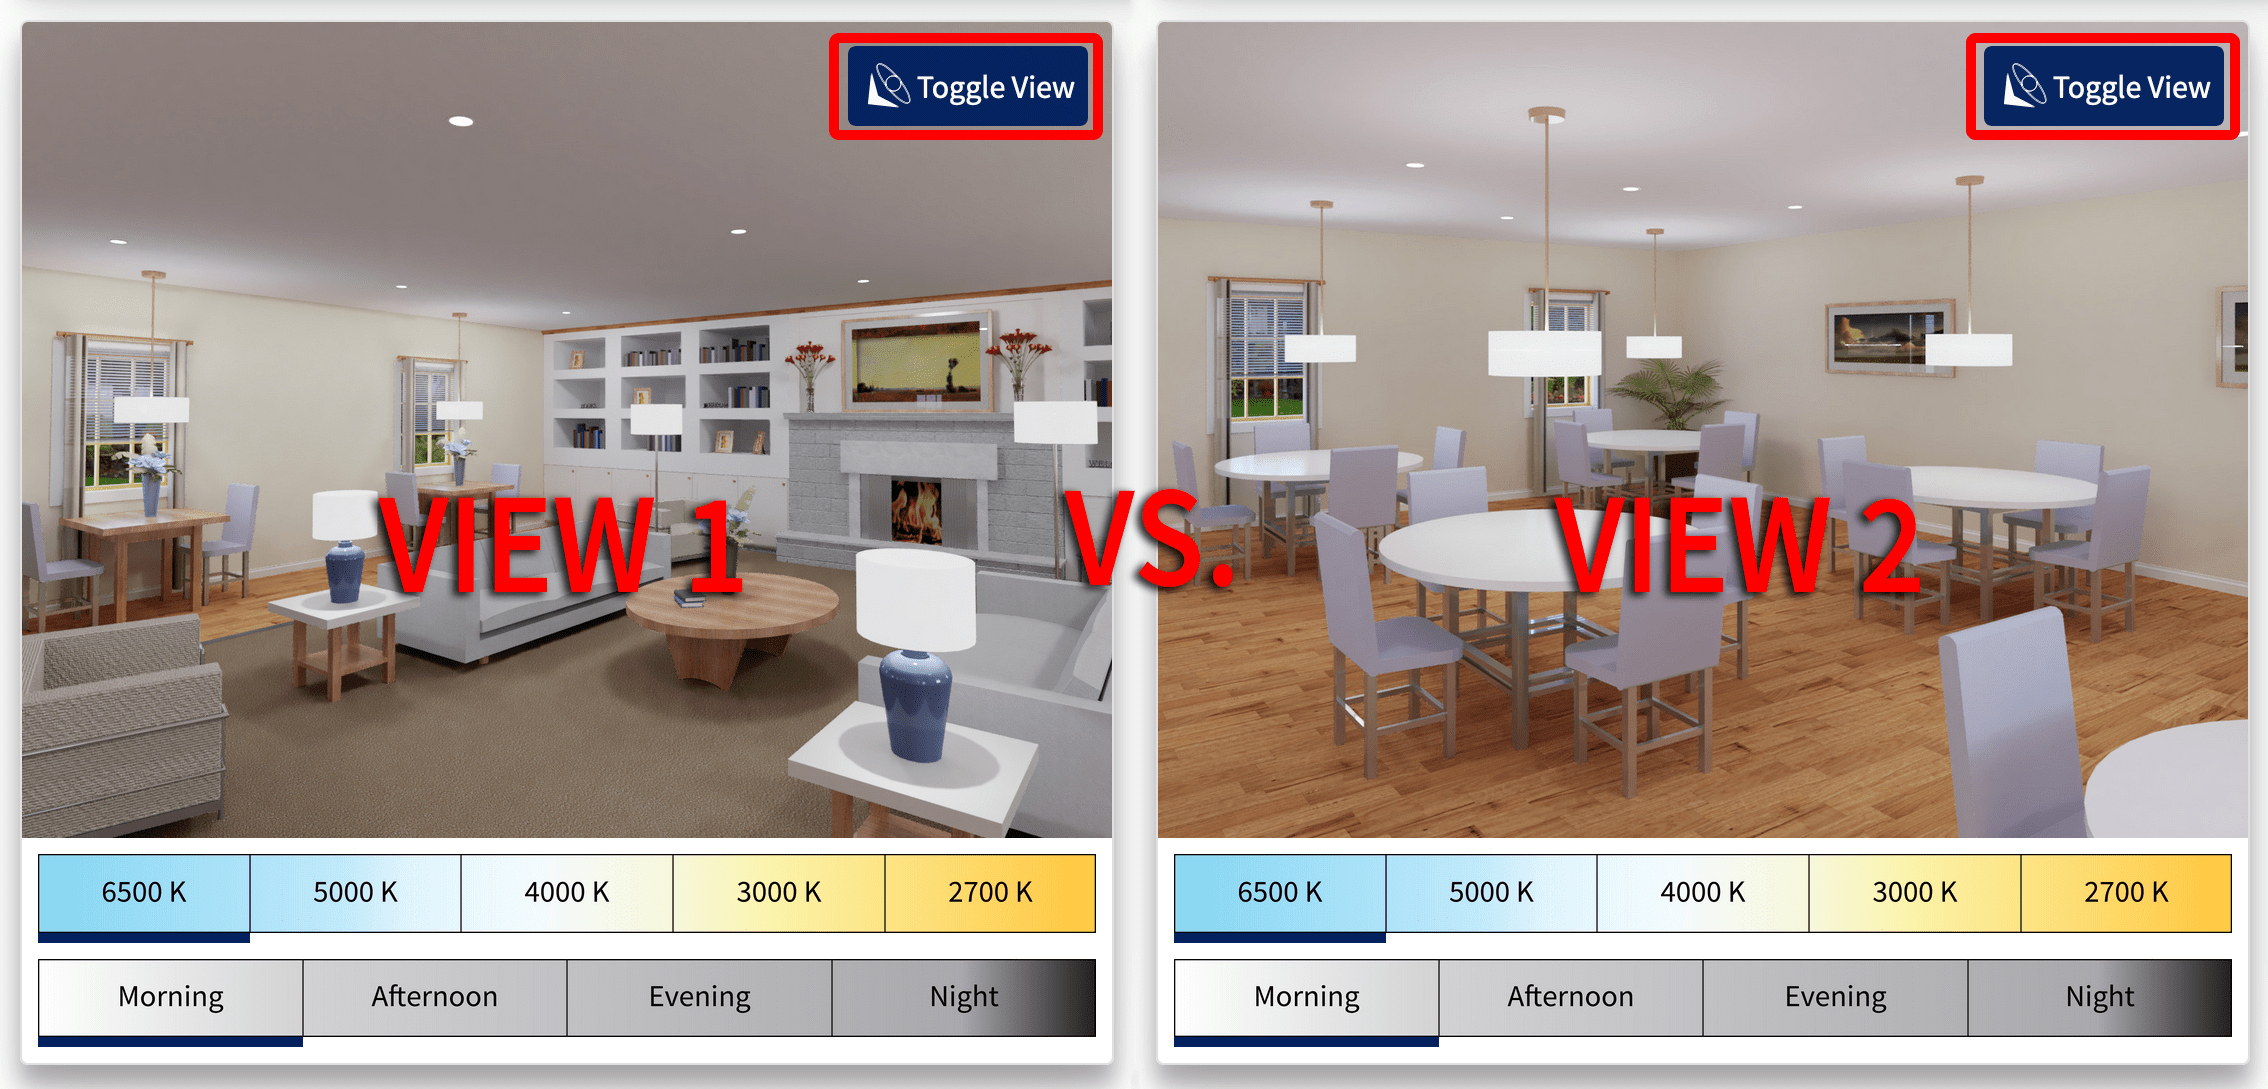
Render
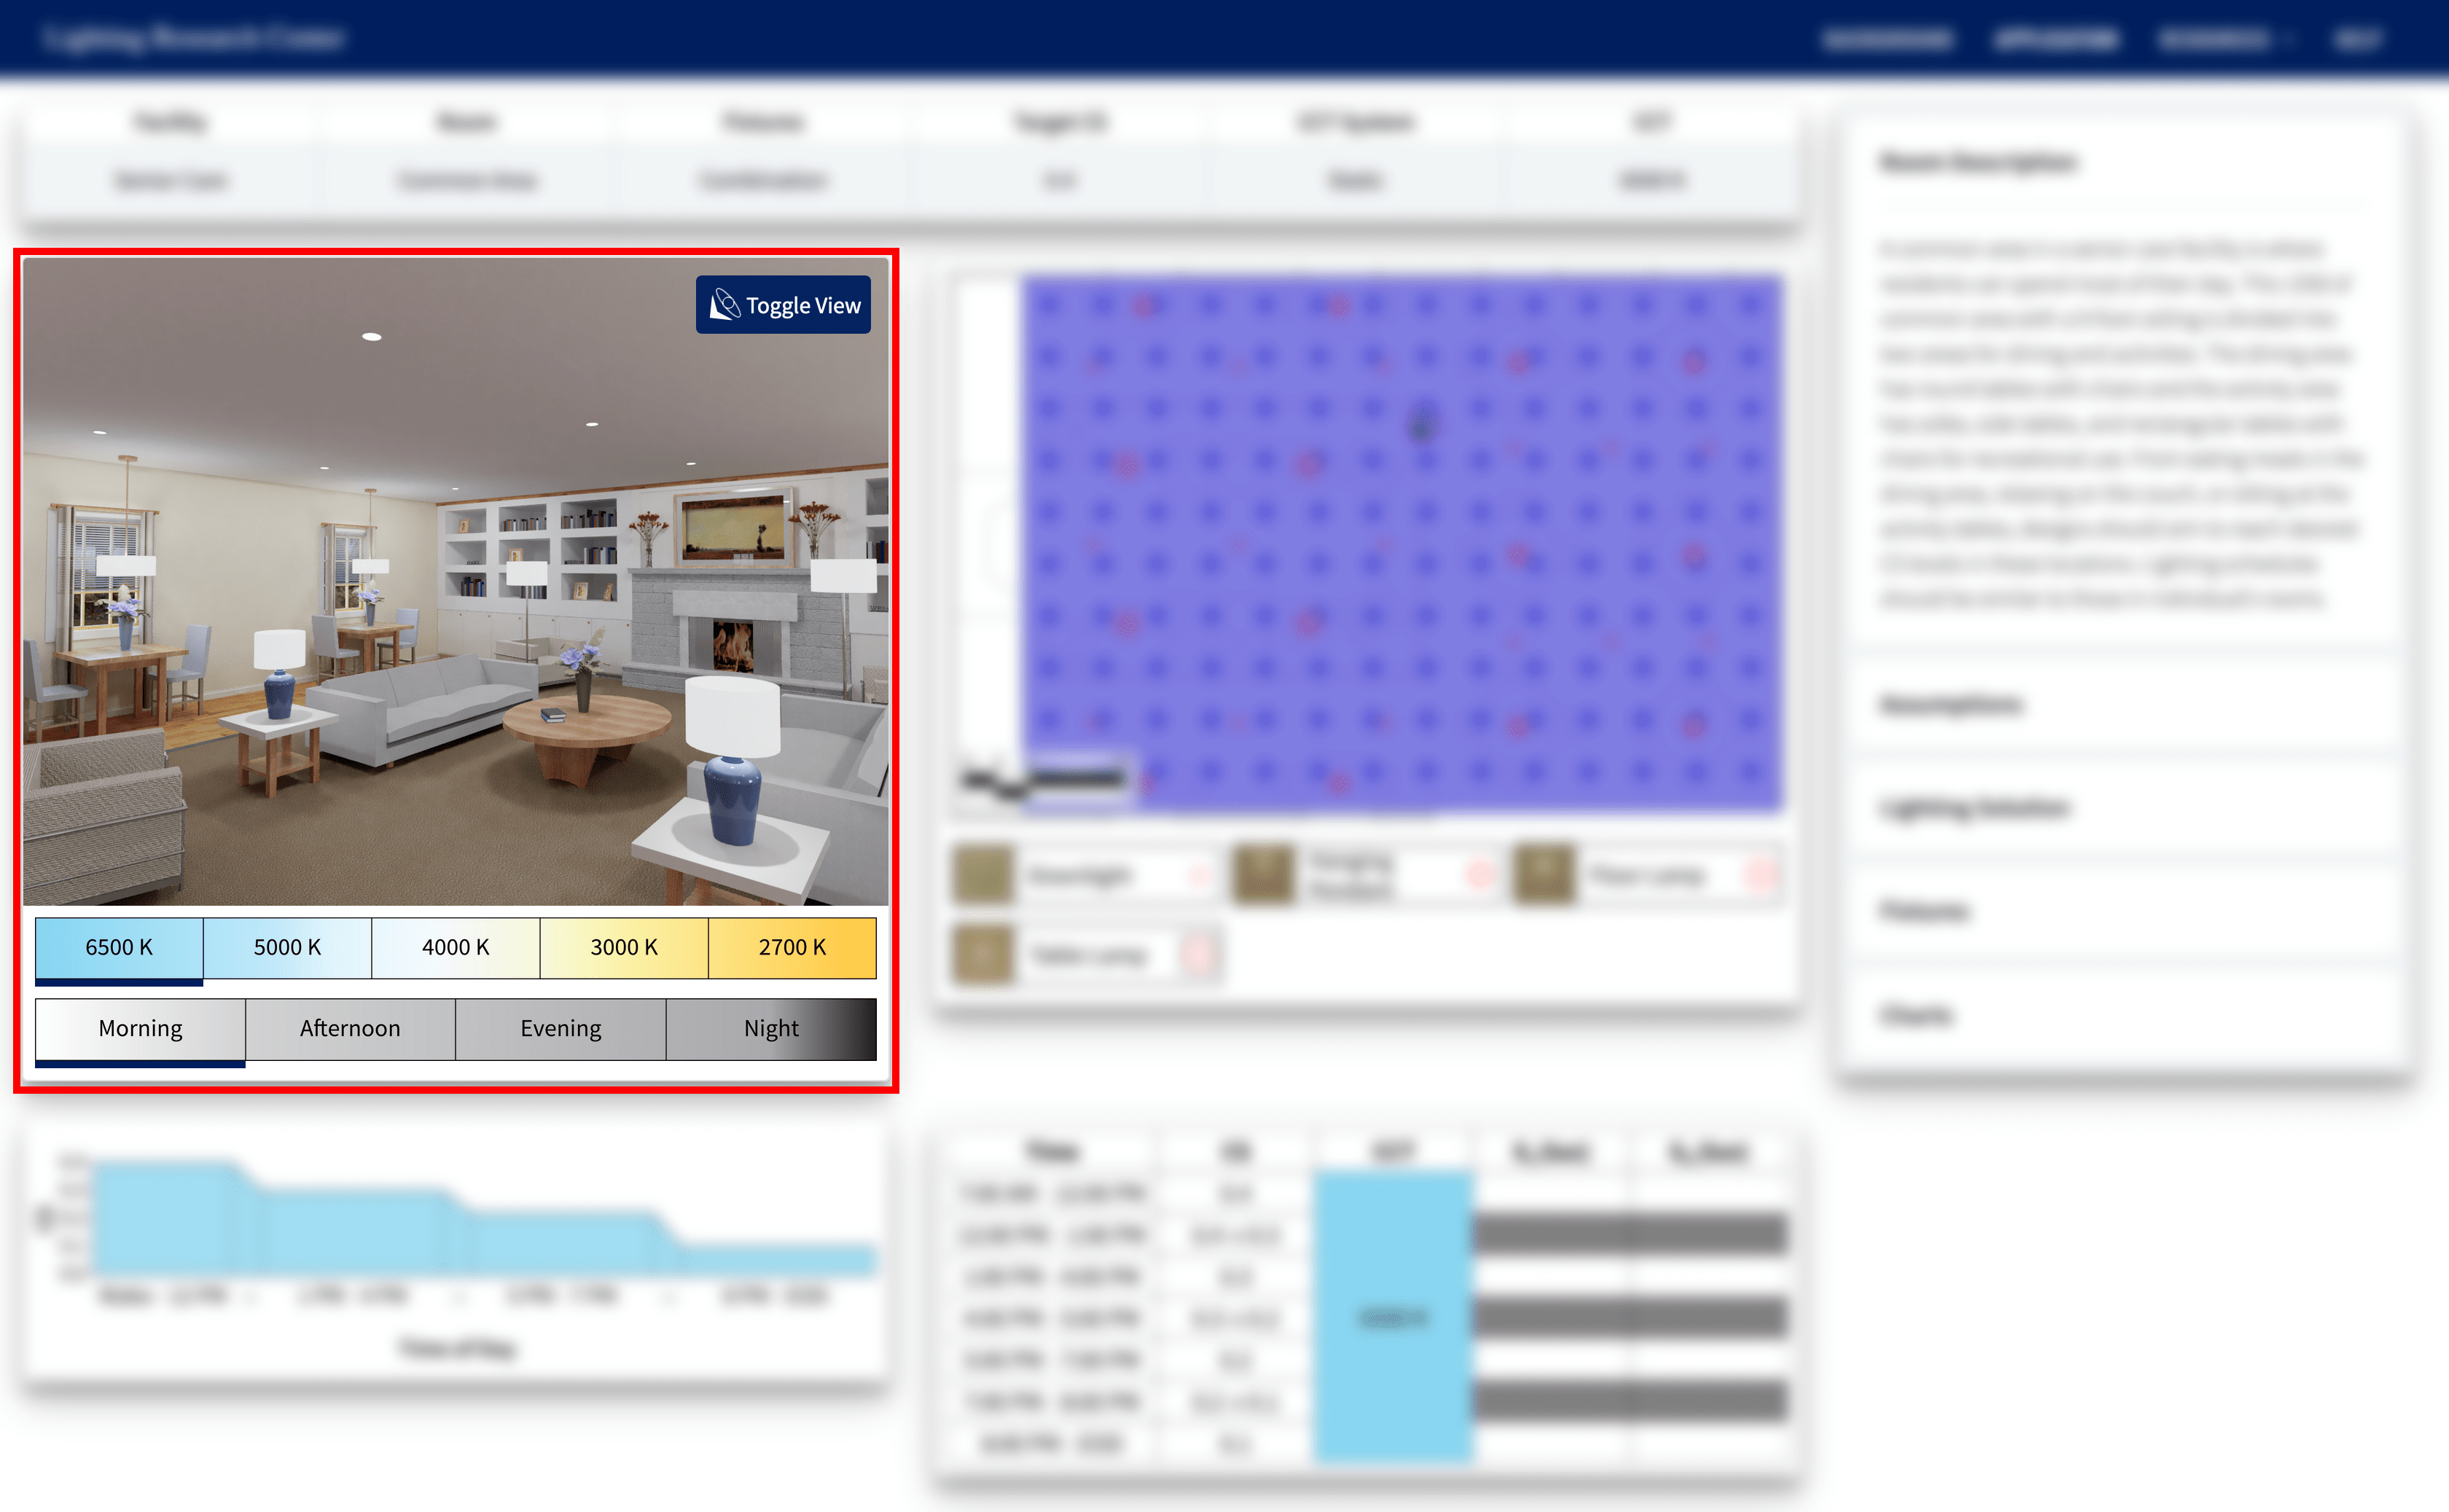
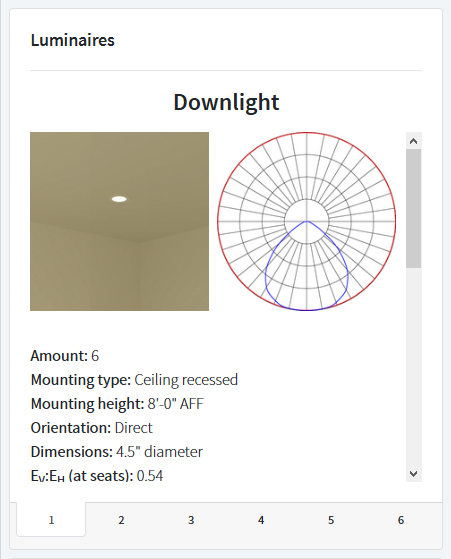
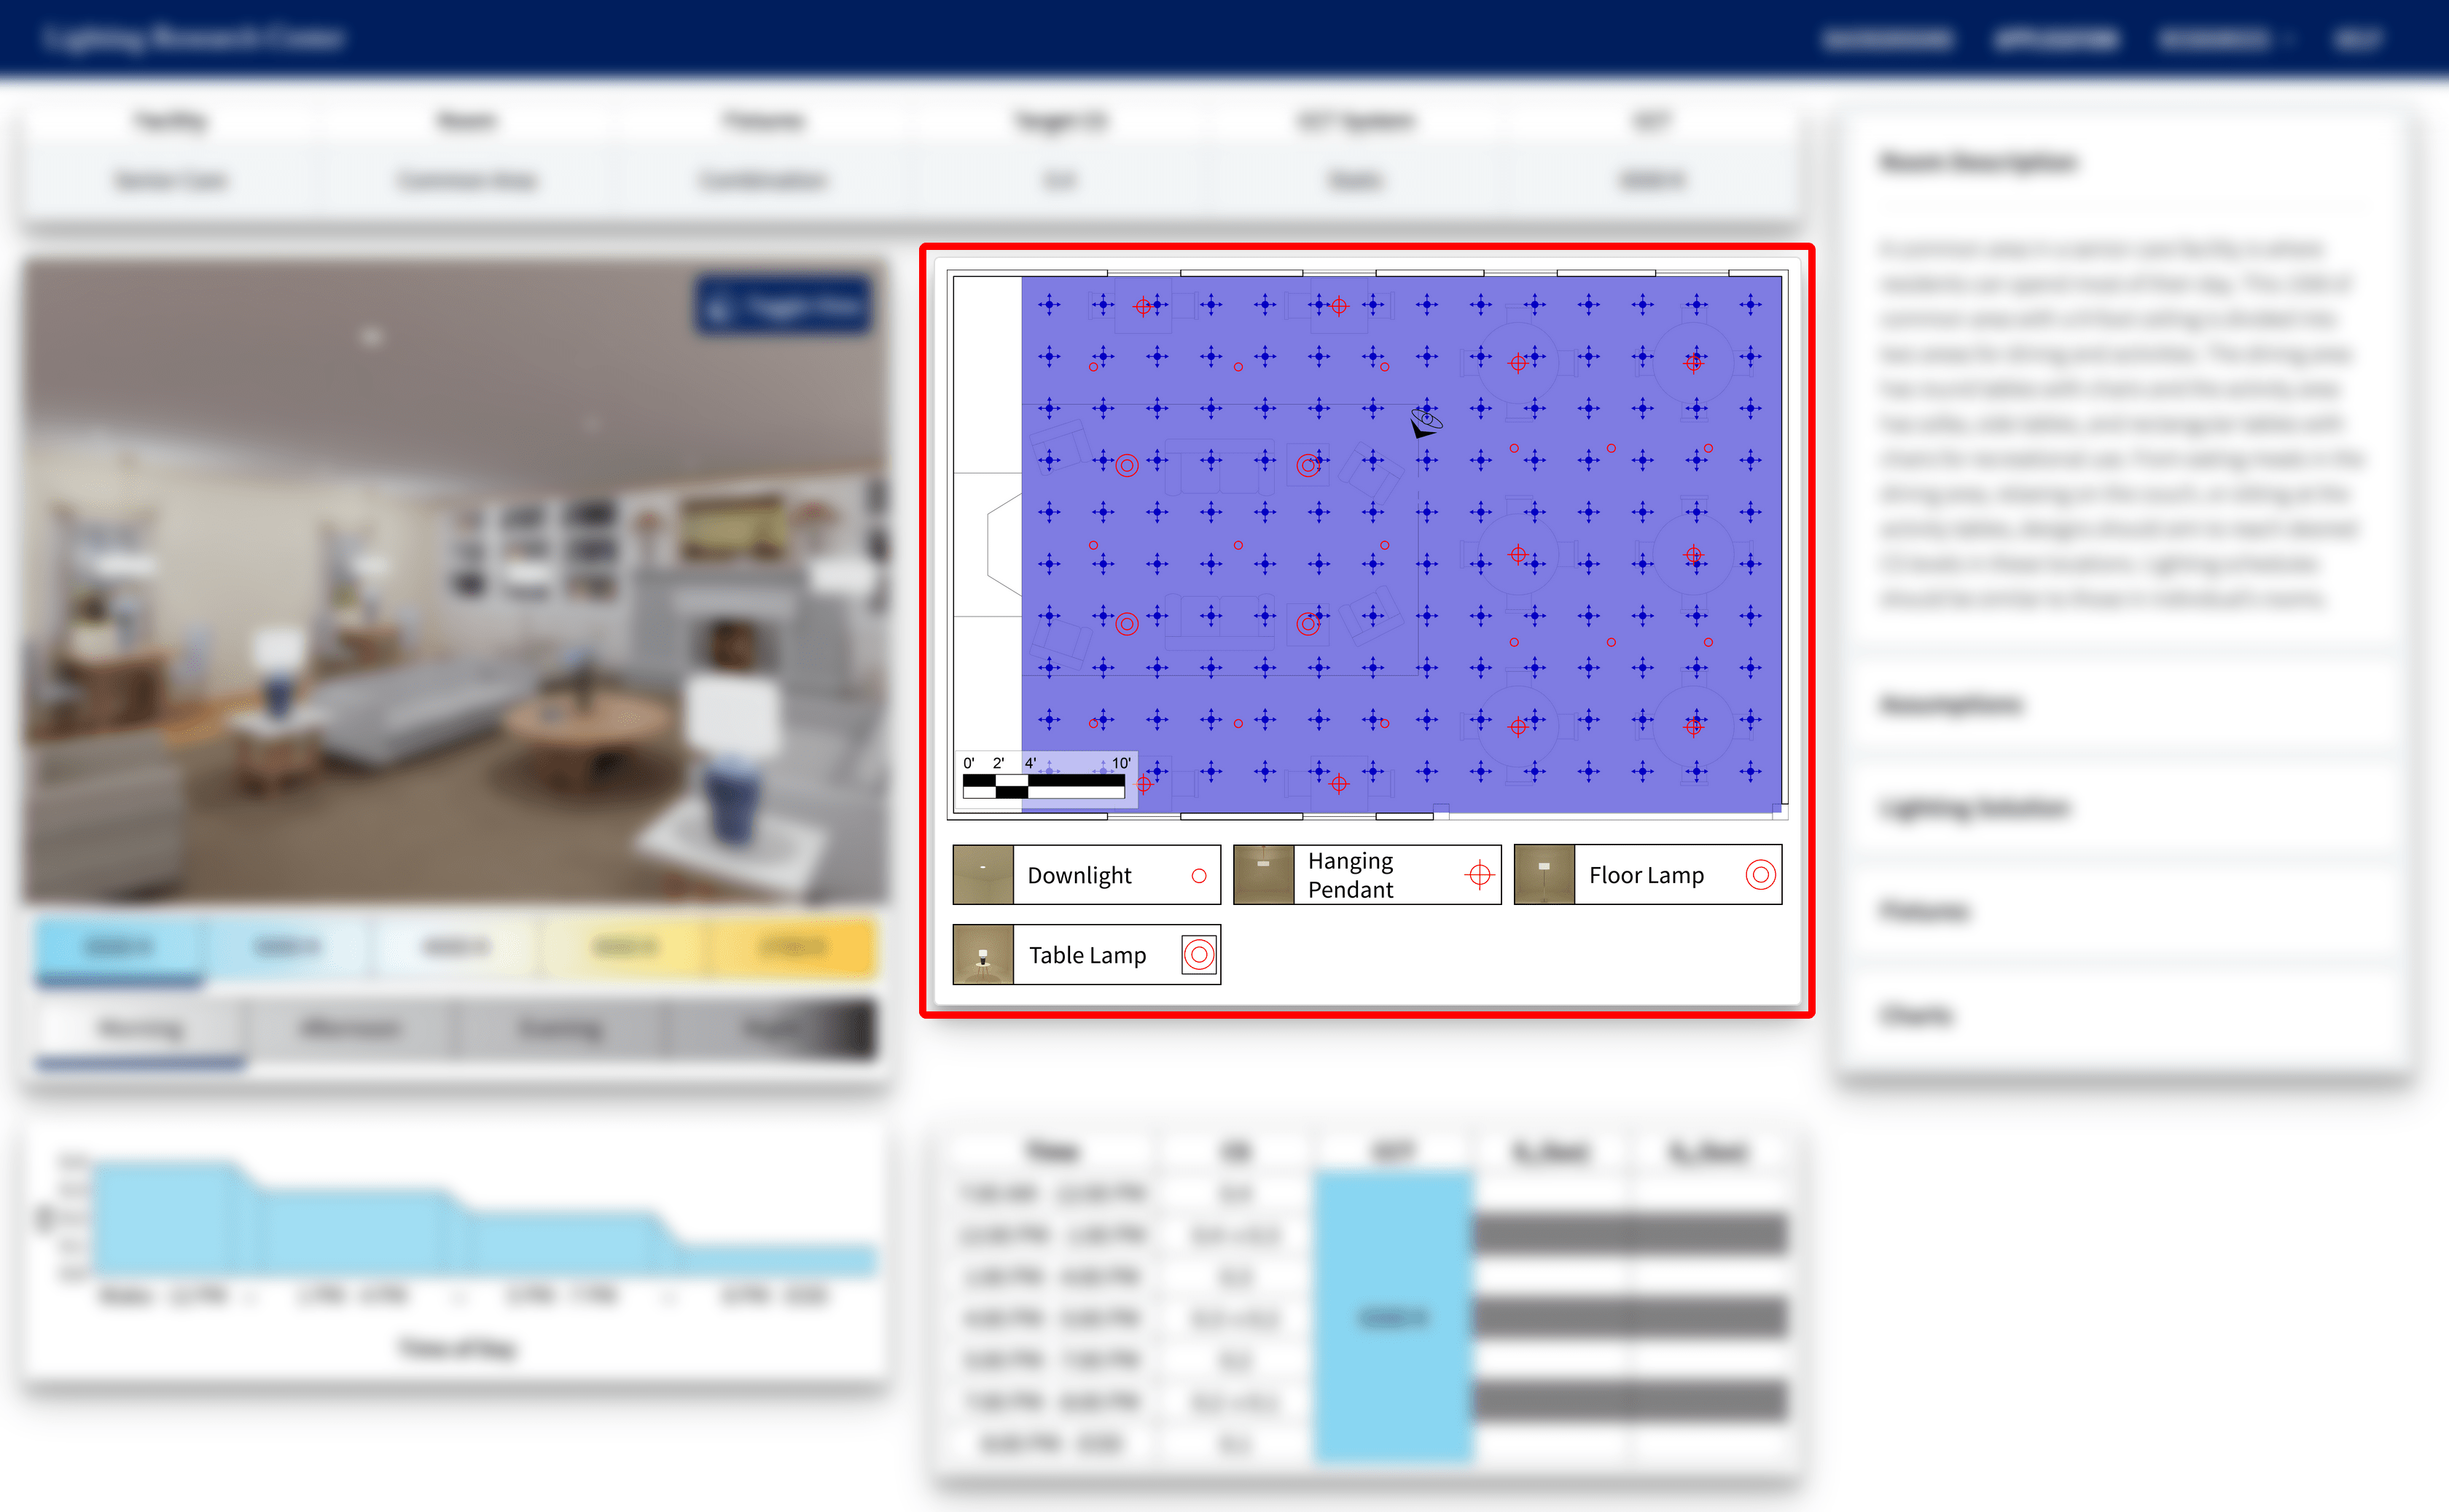
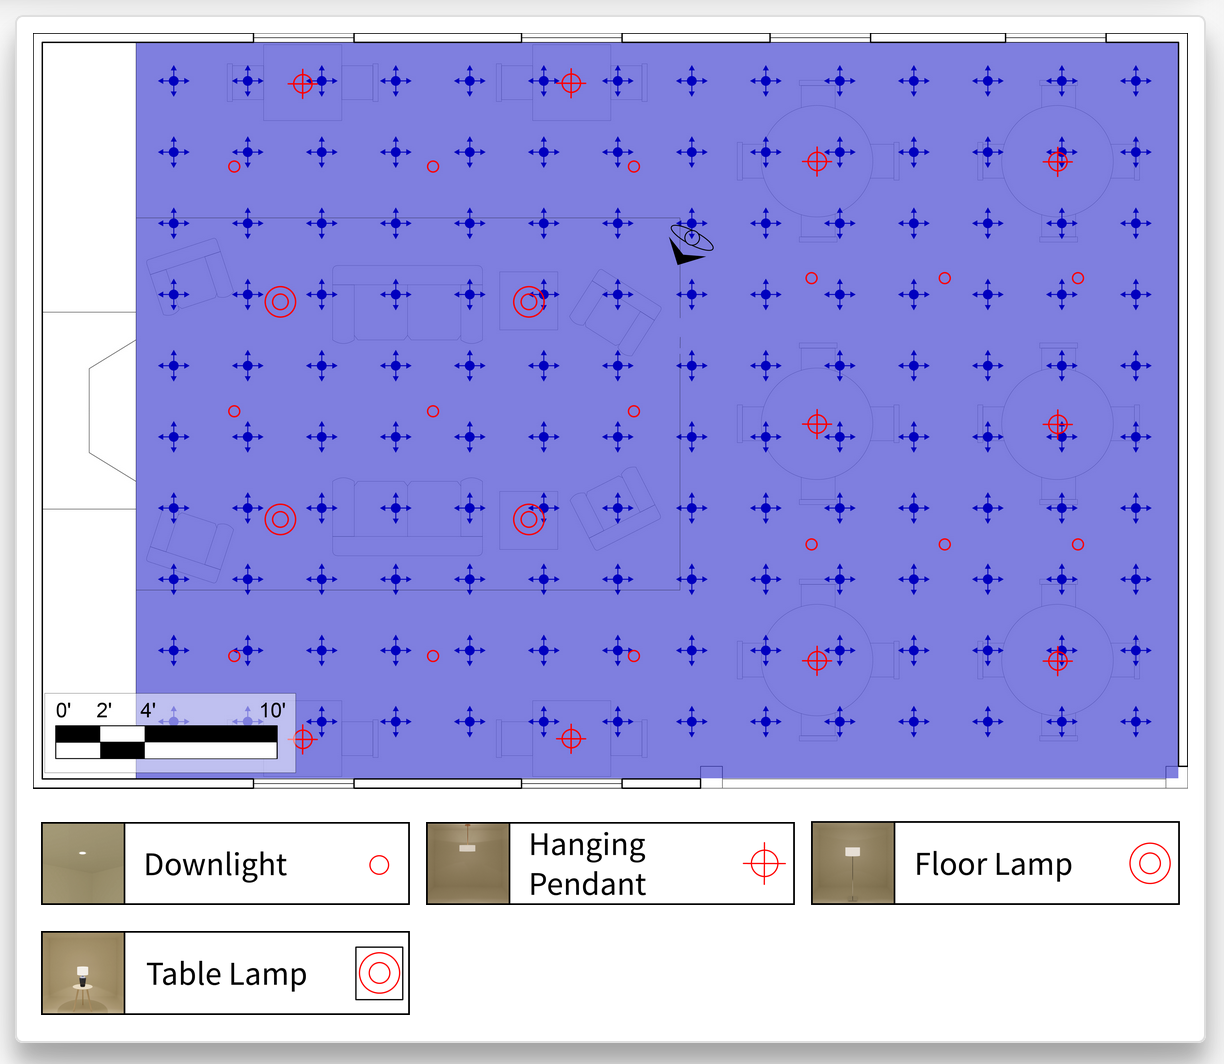
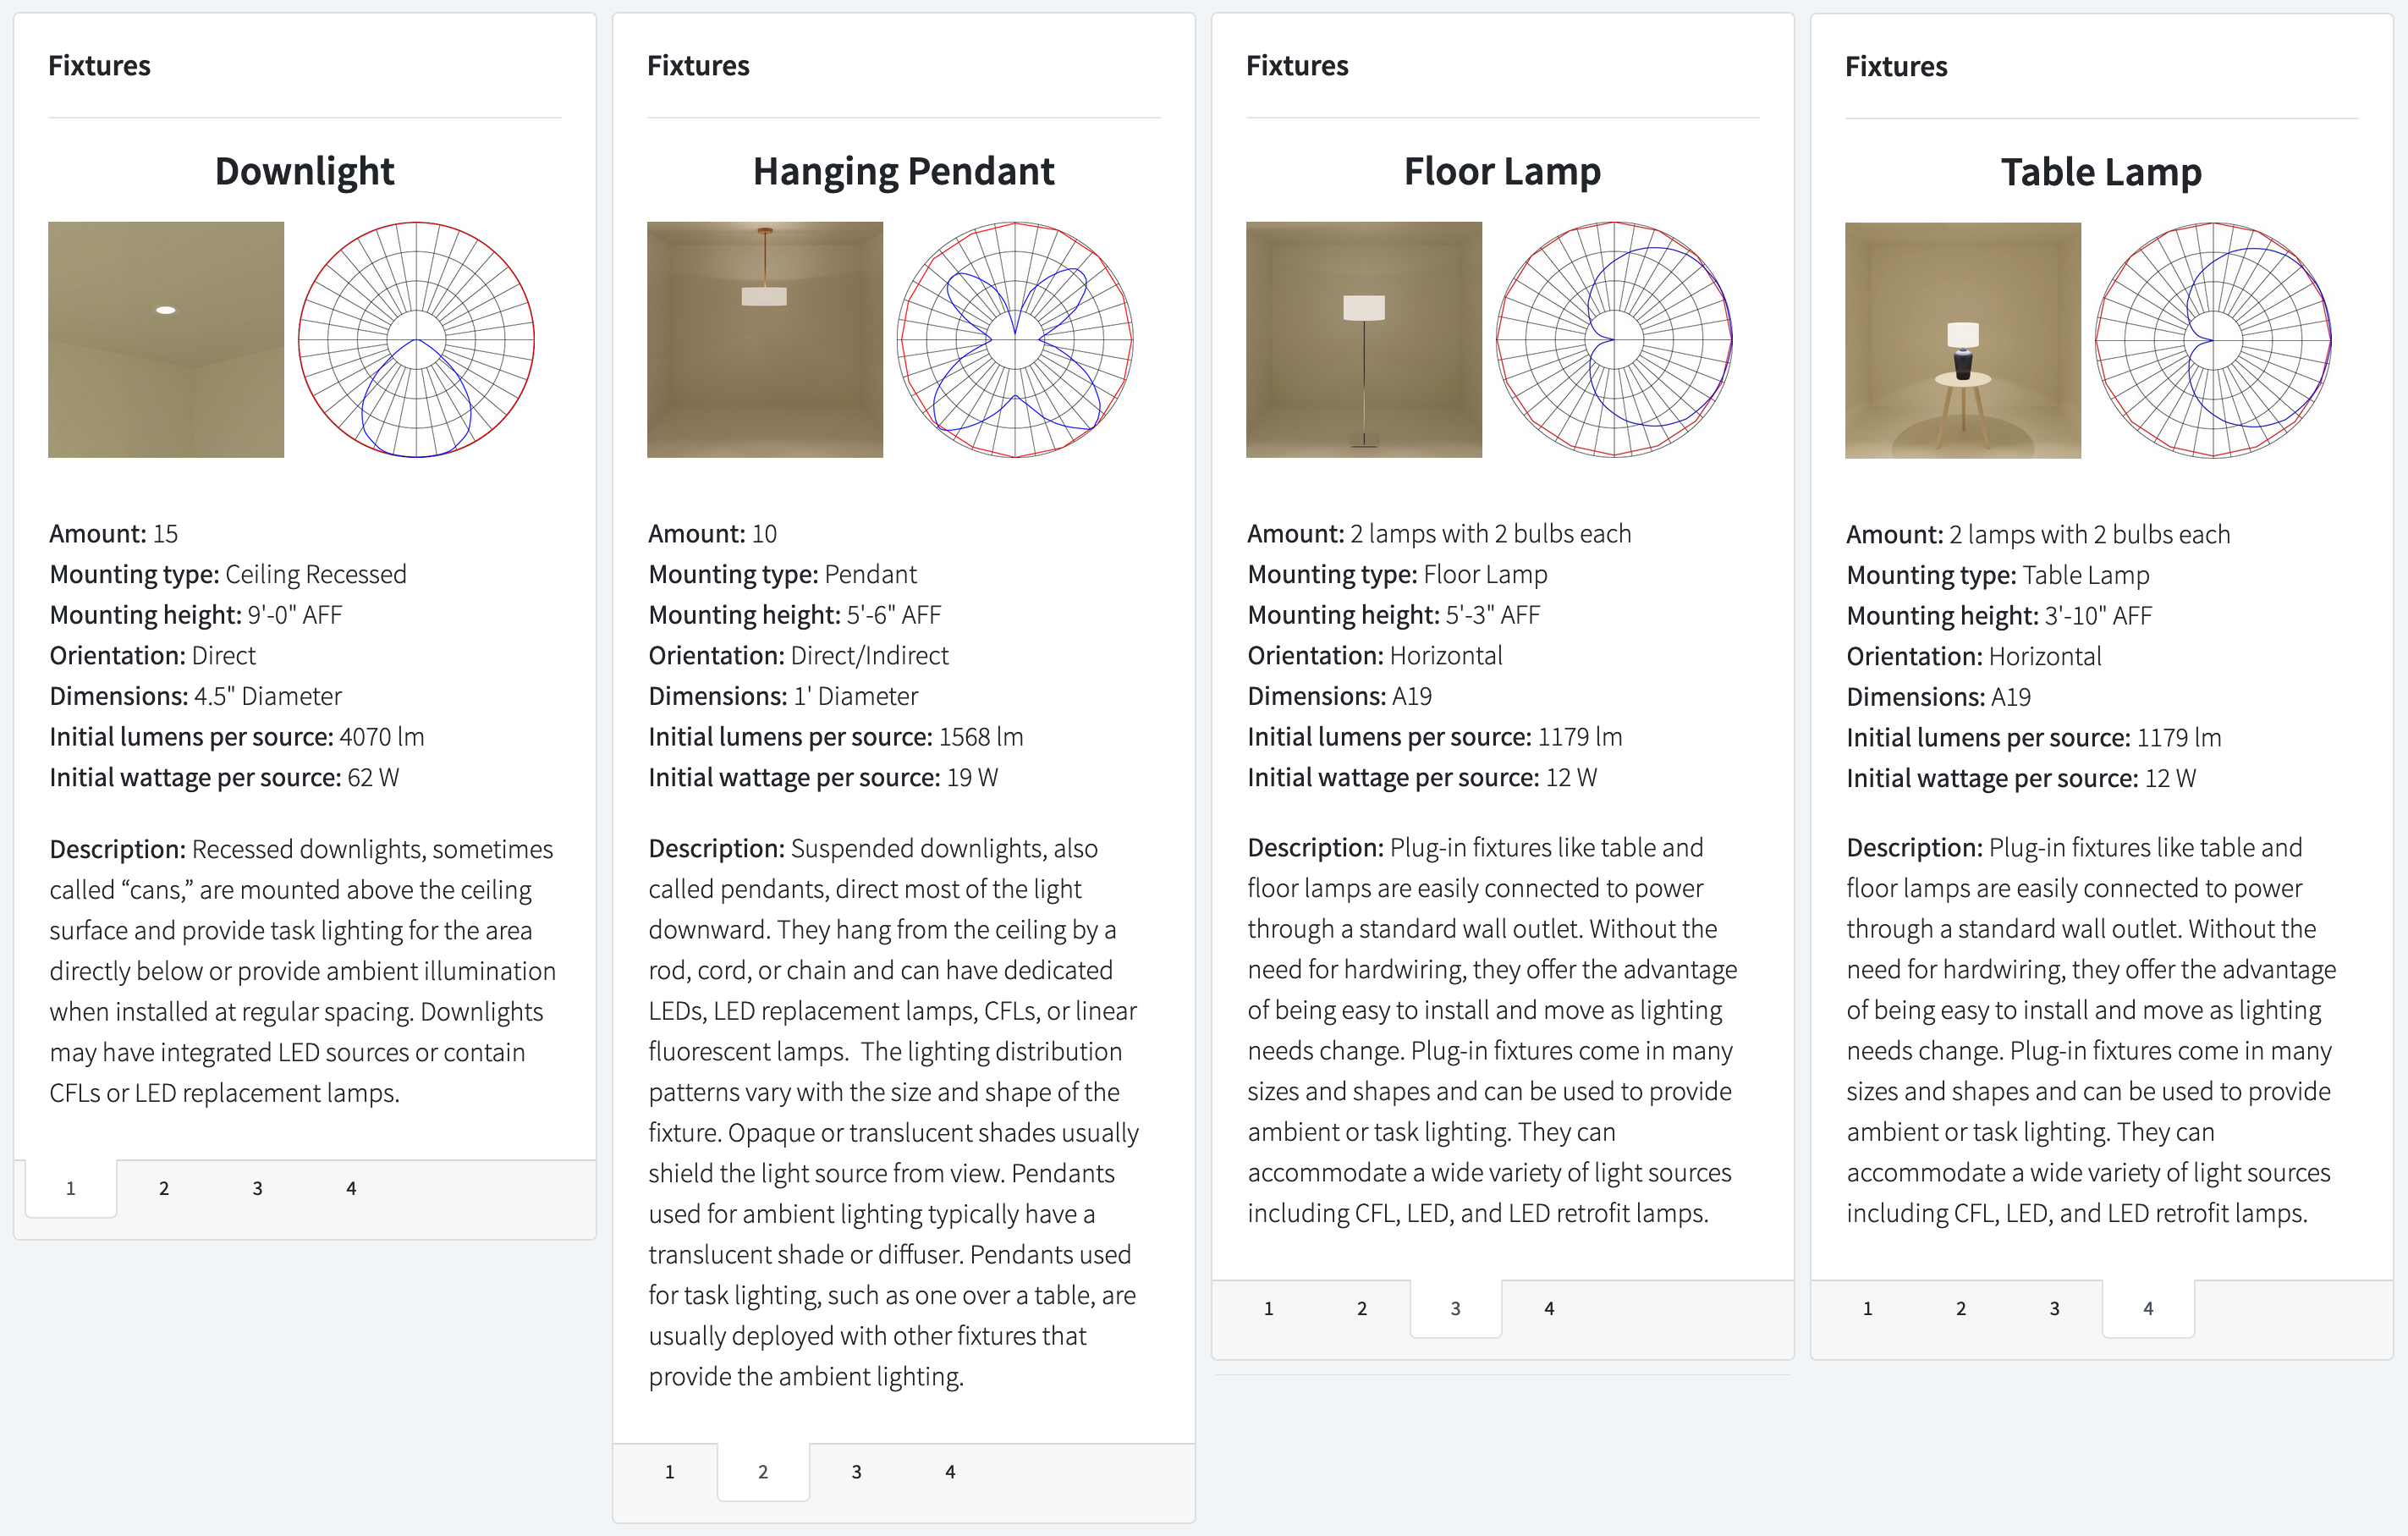
Lighting layout


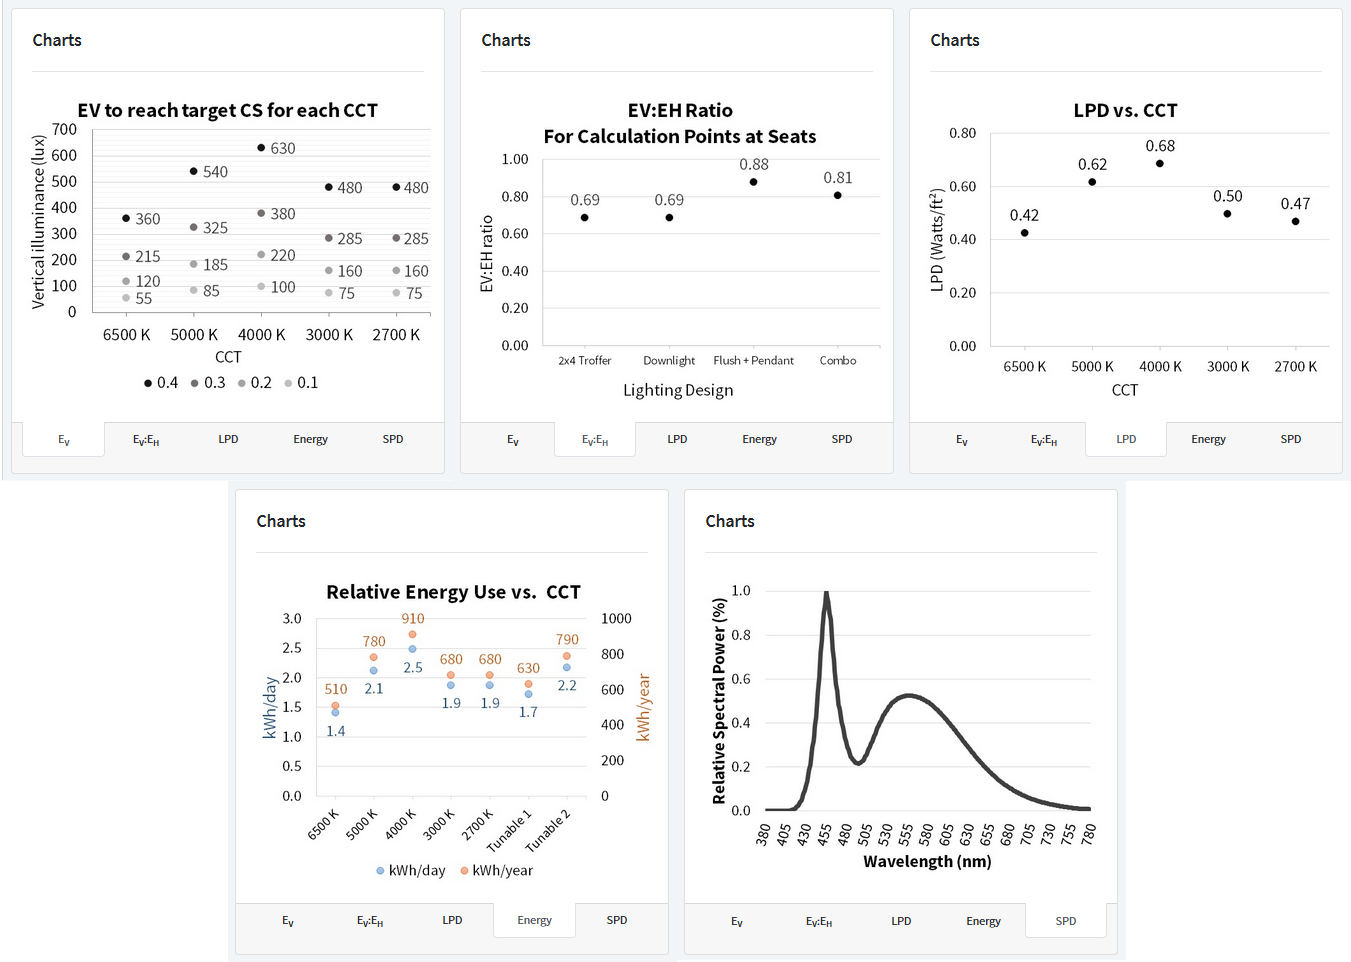
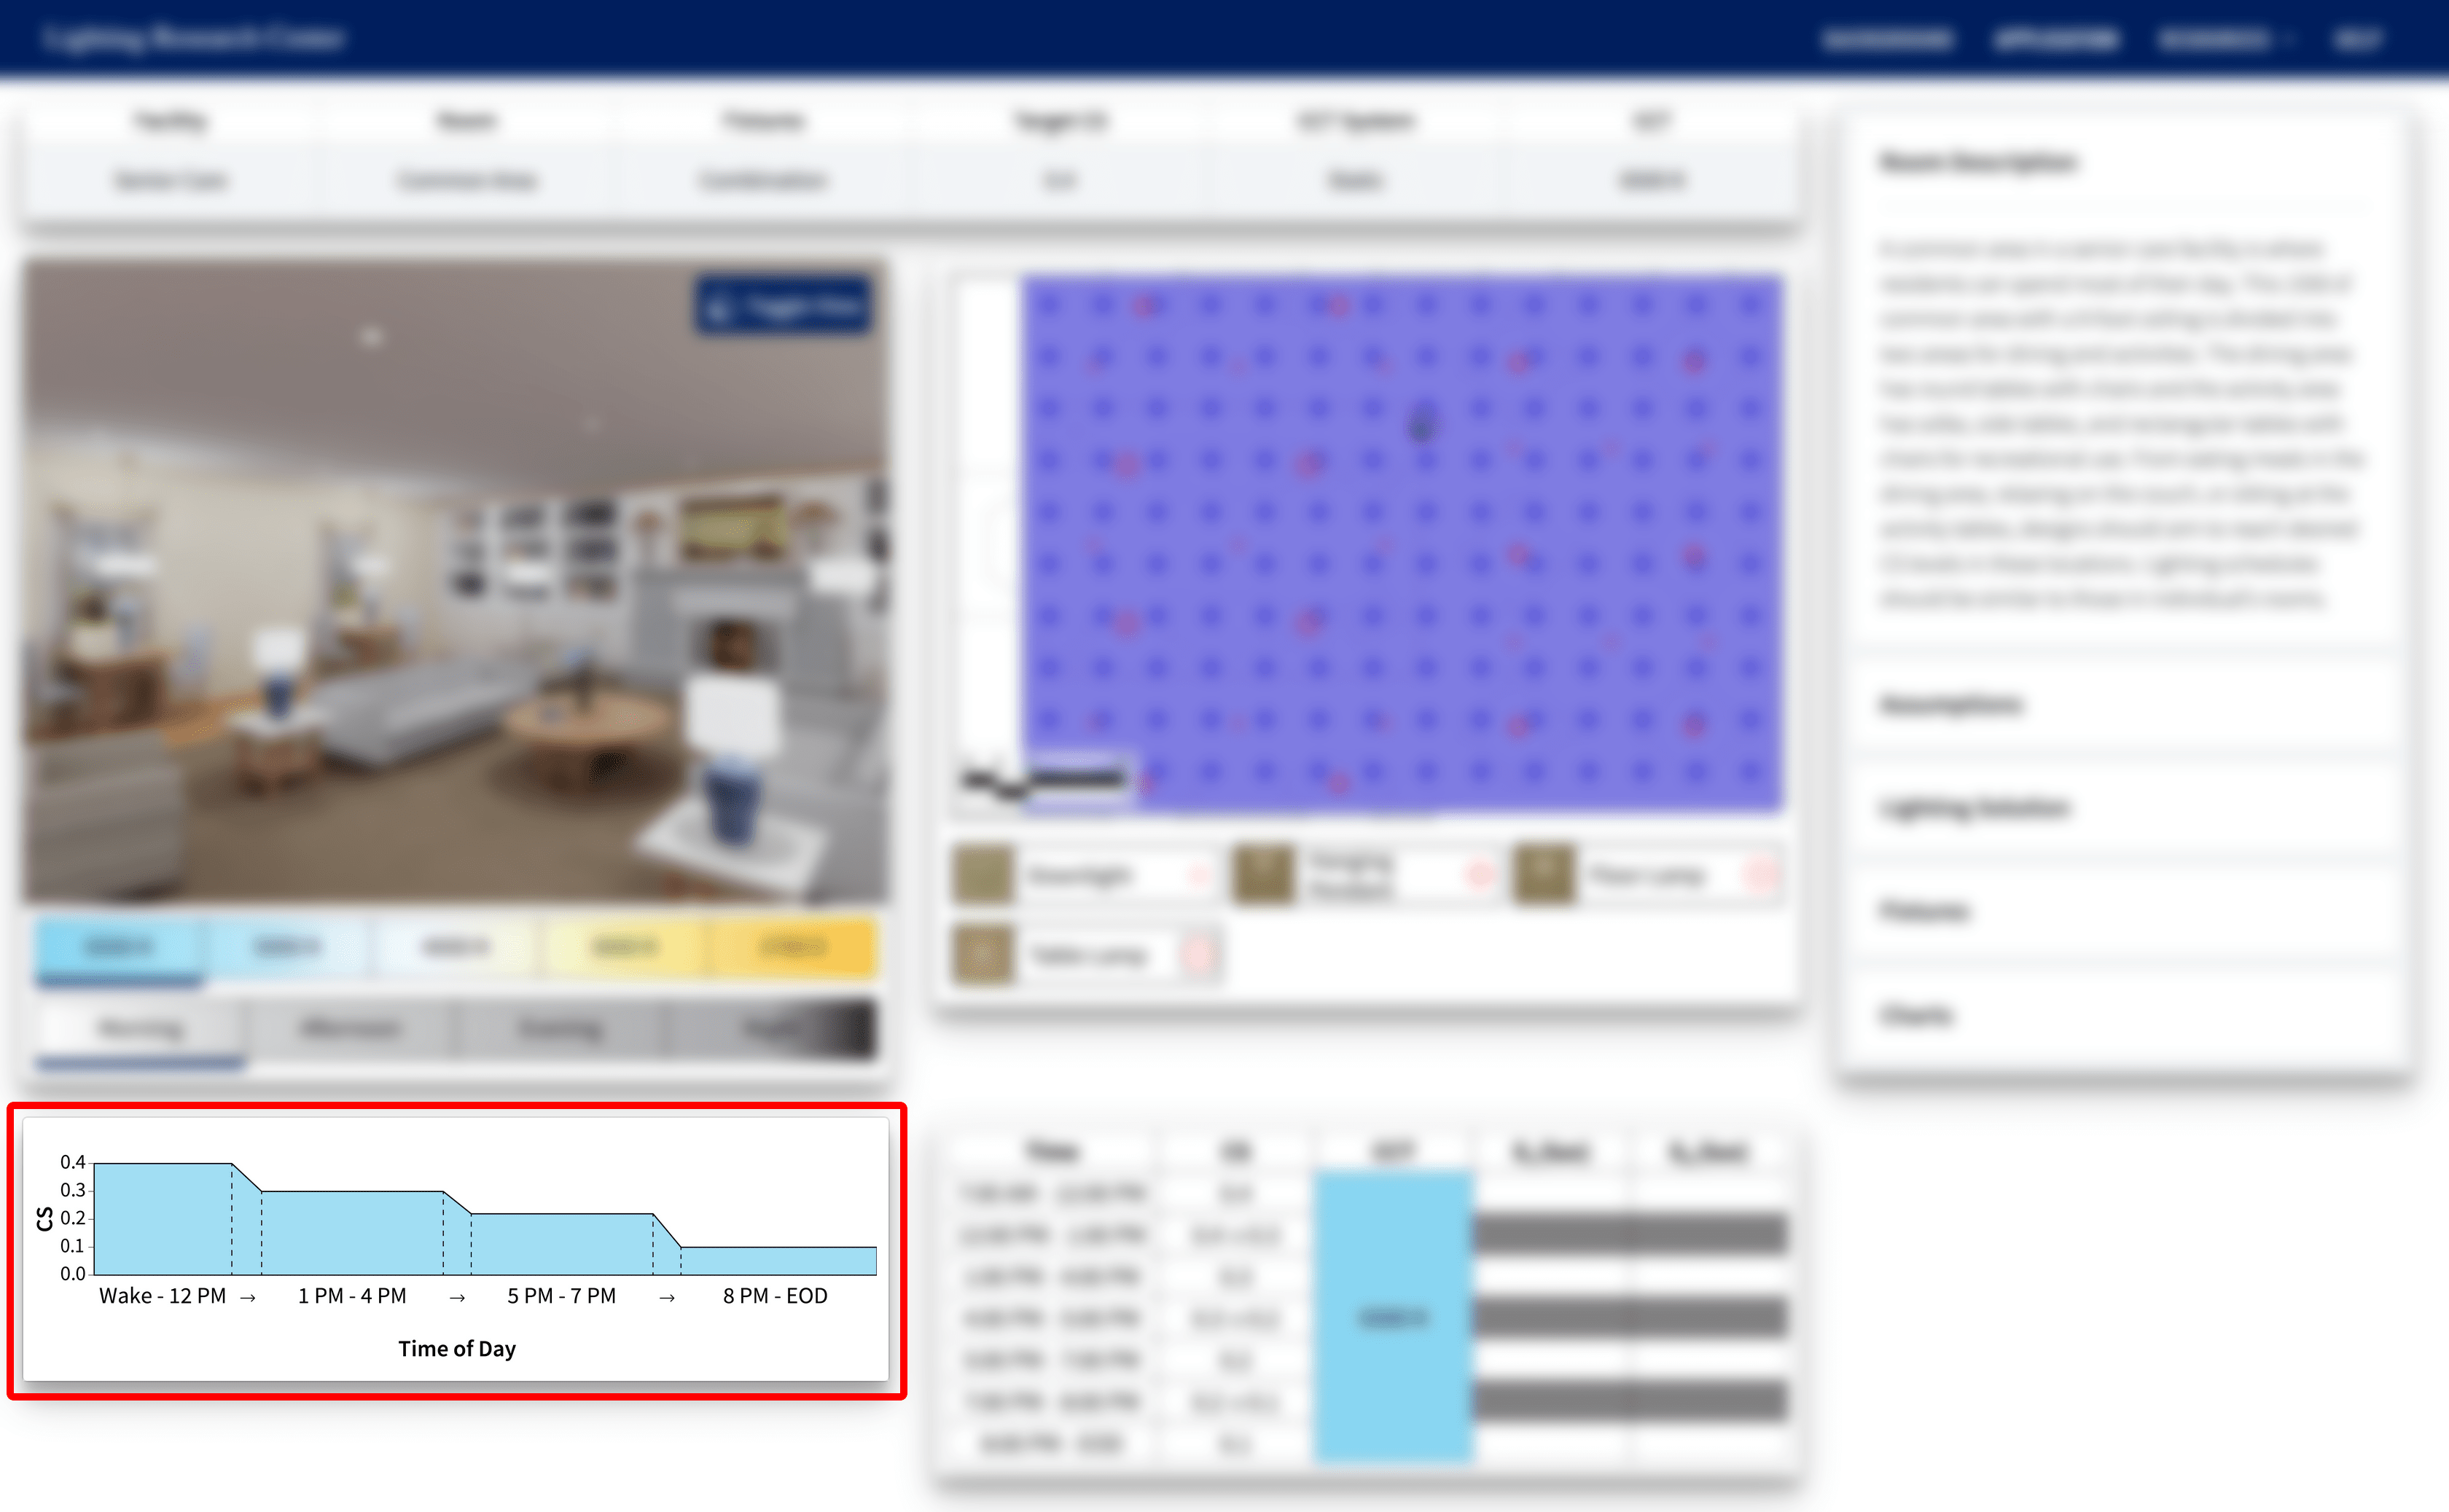
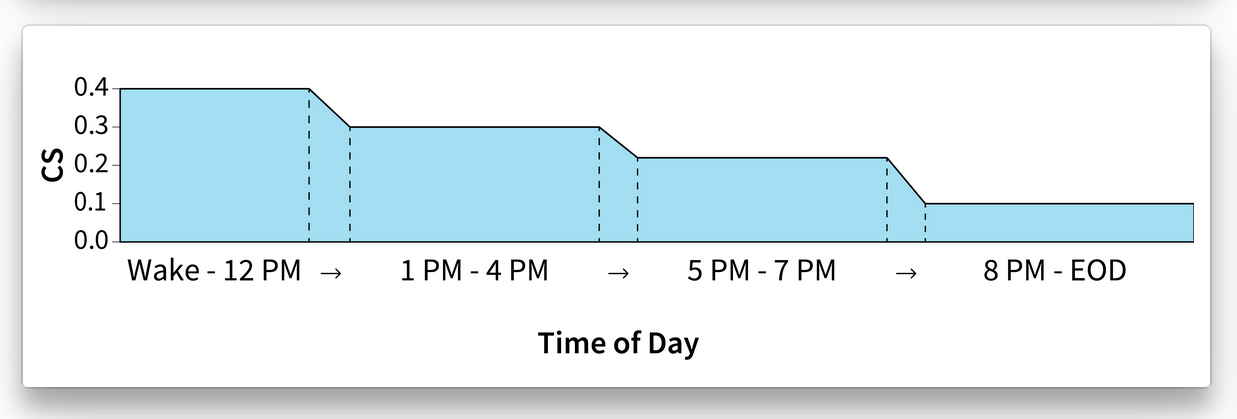
CS Graph
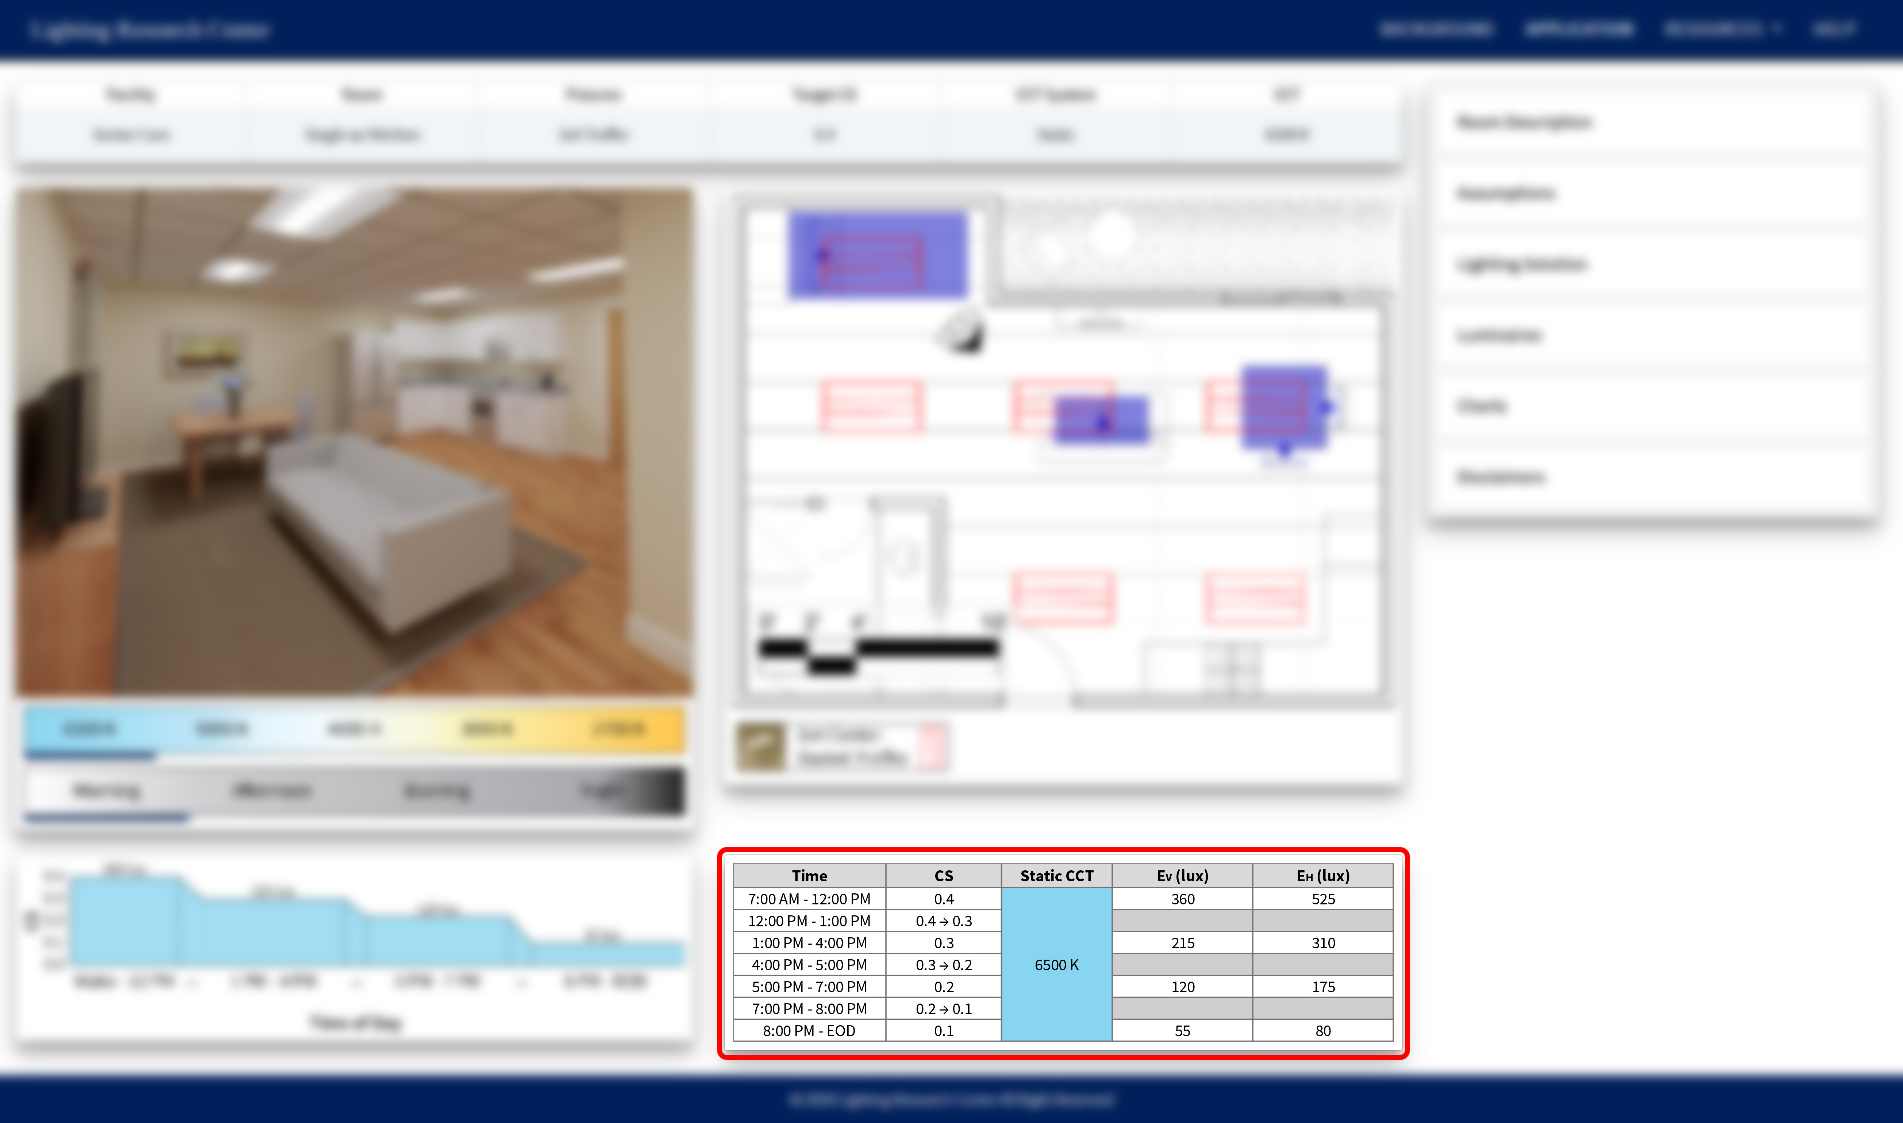
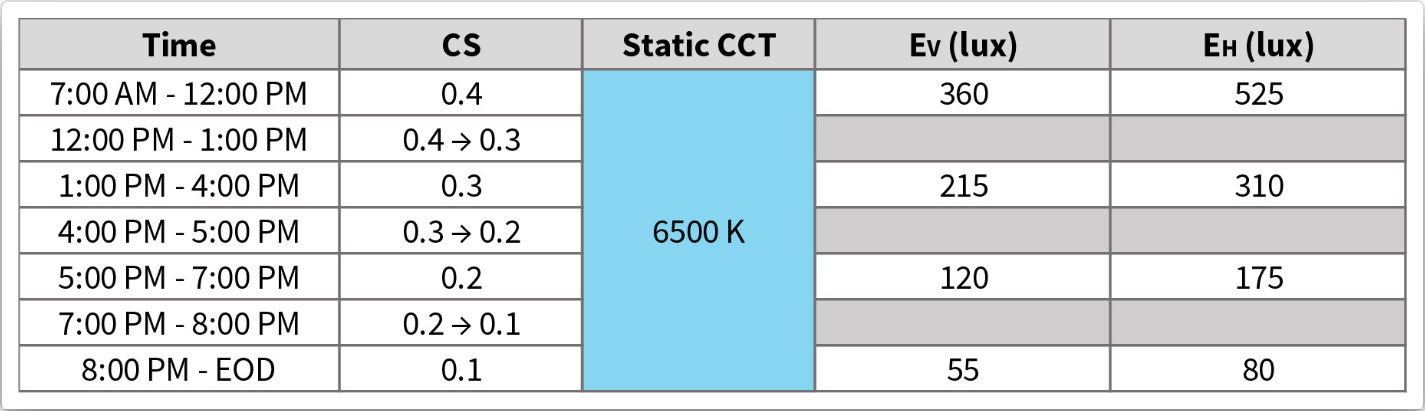
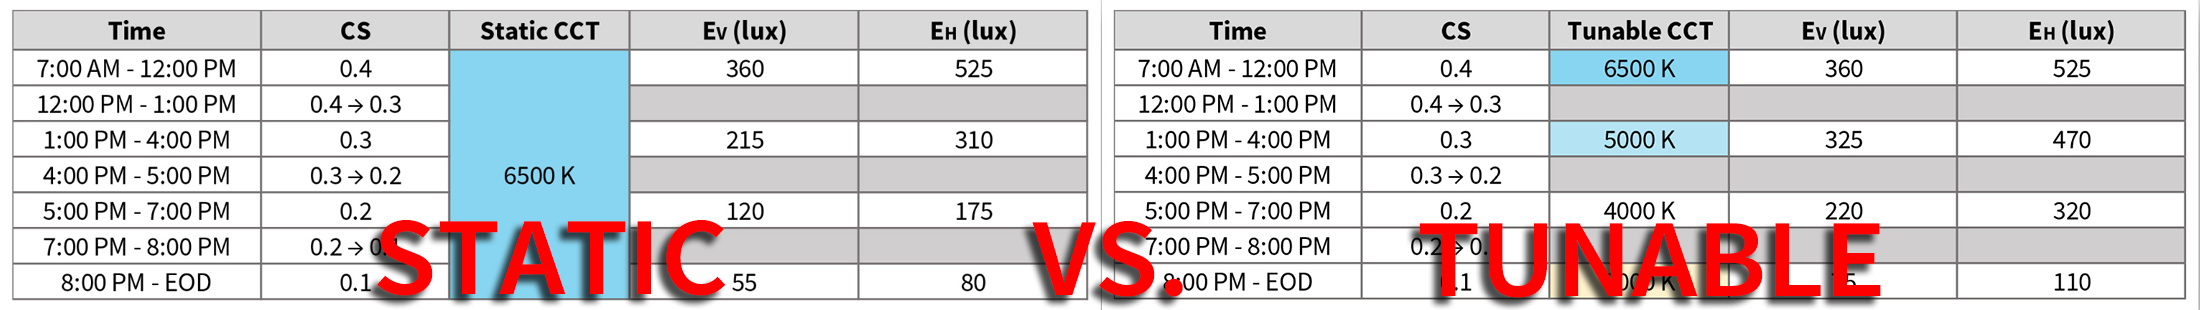
CS Chart
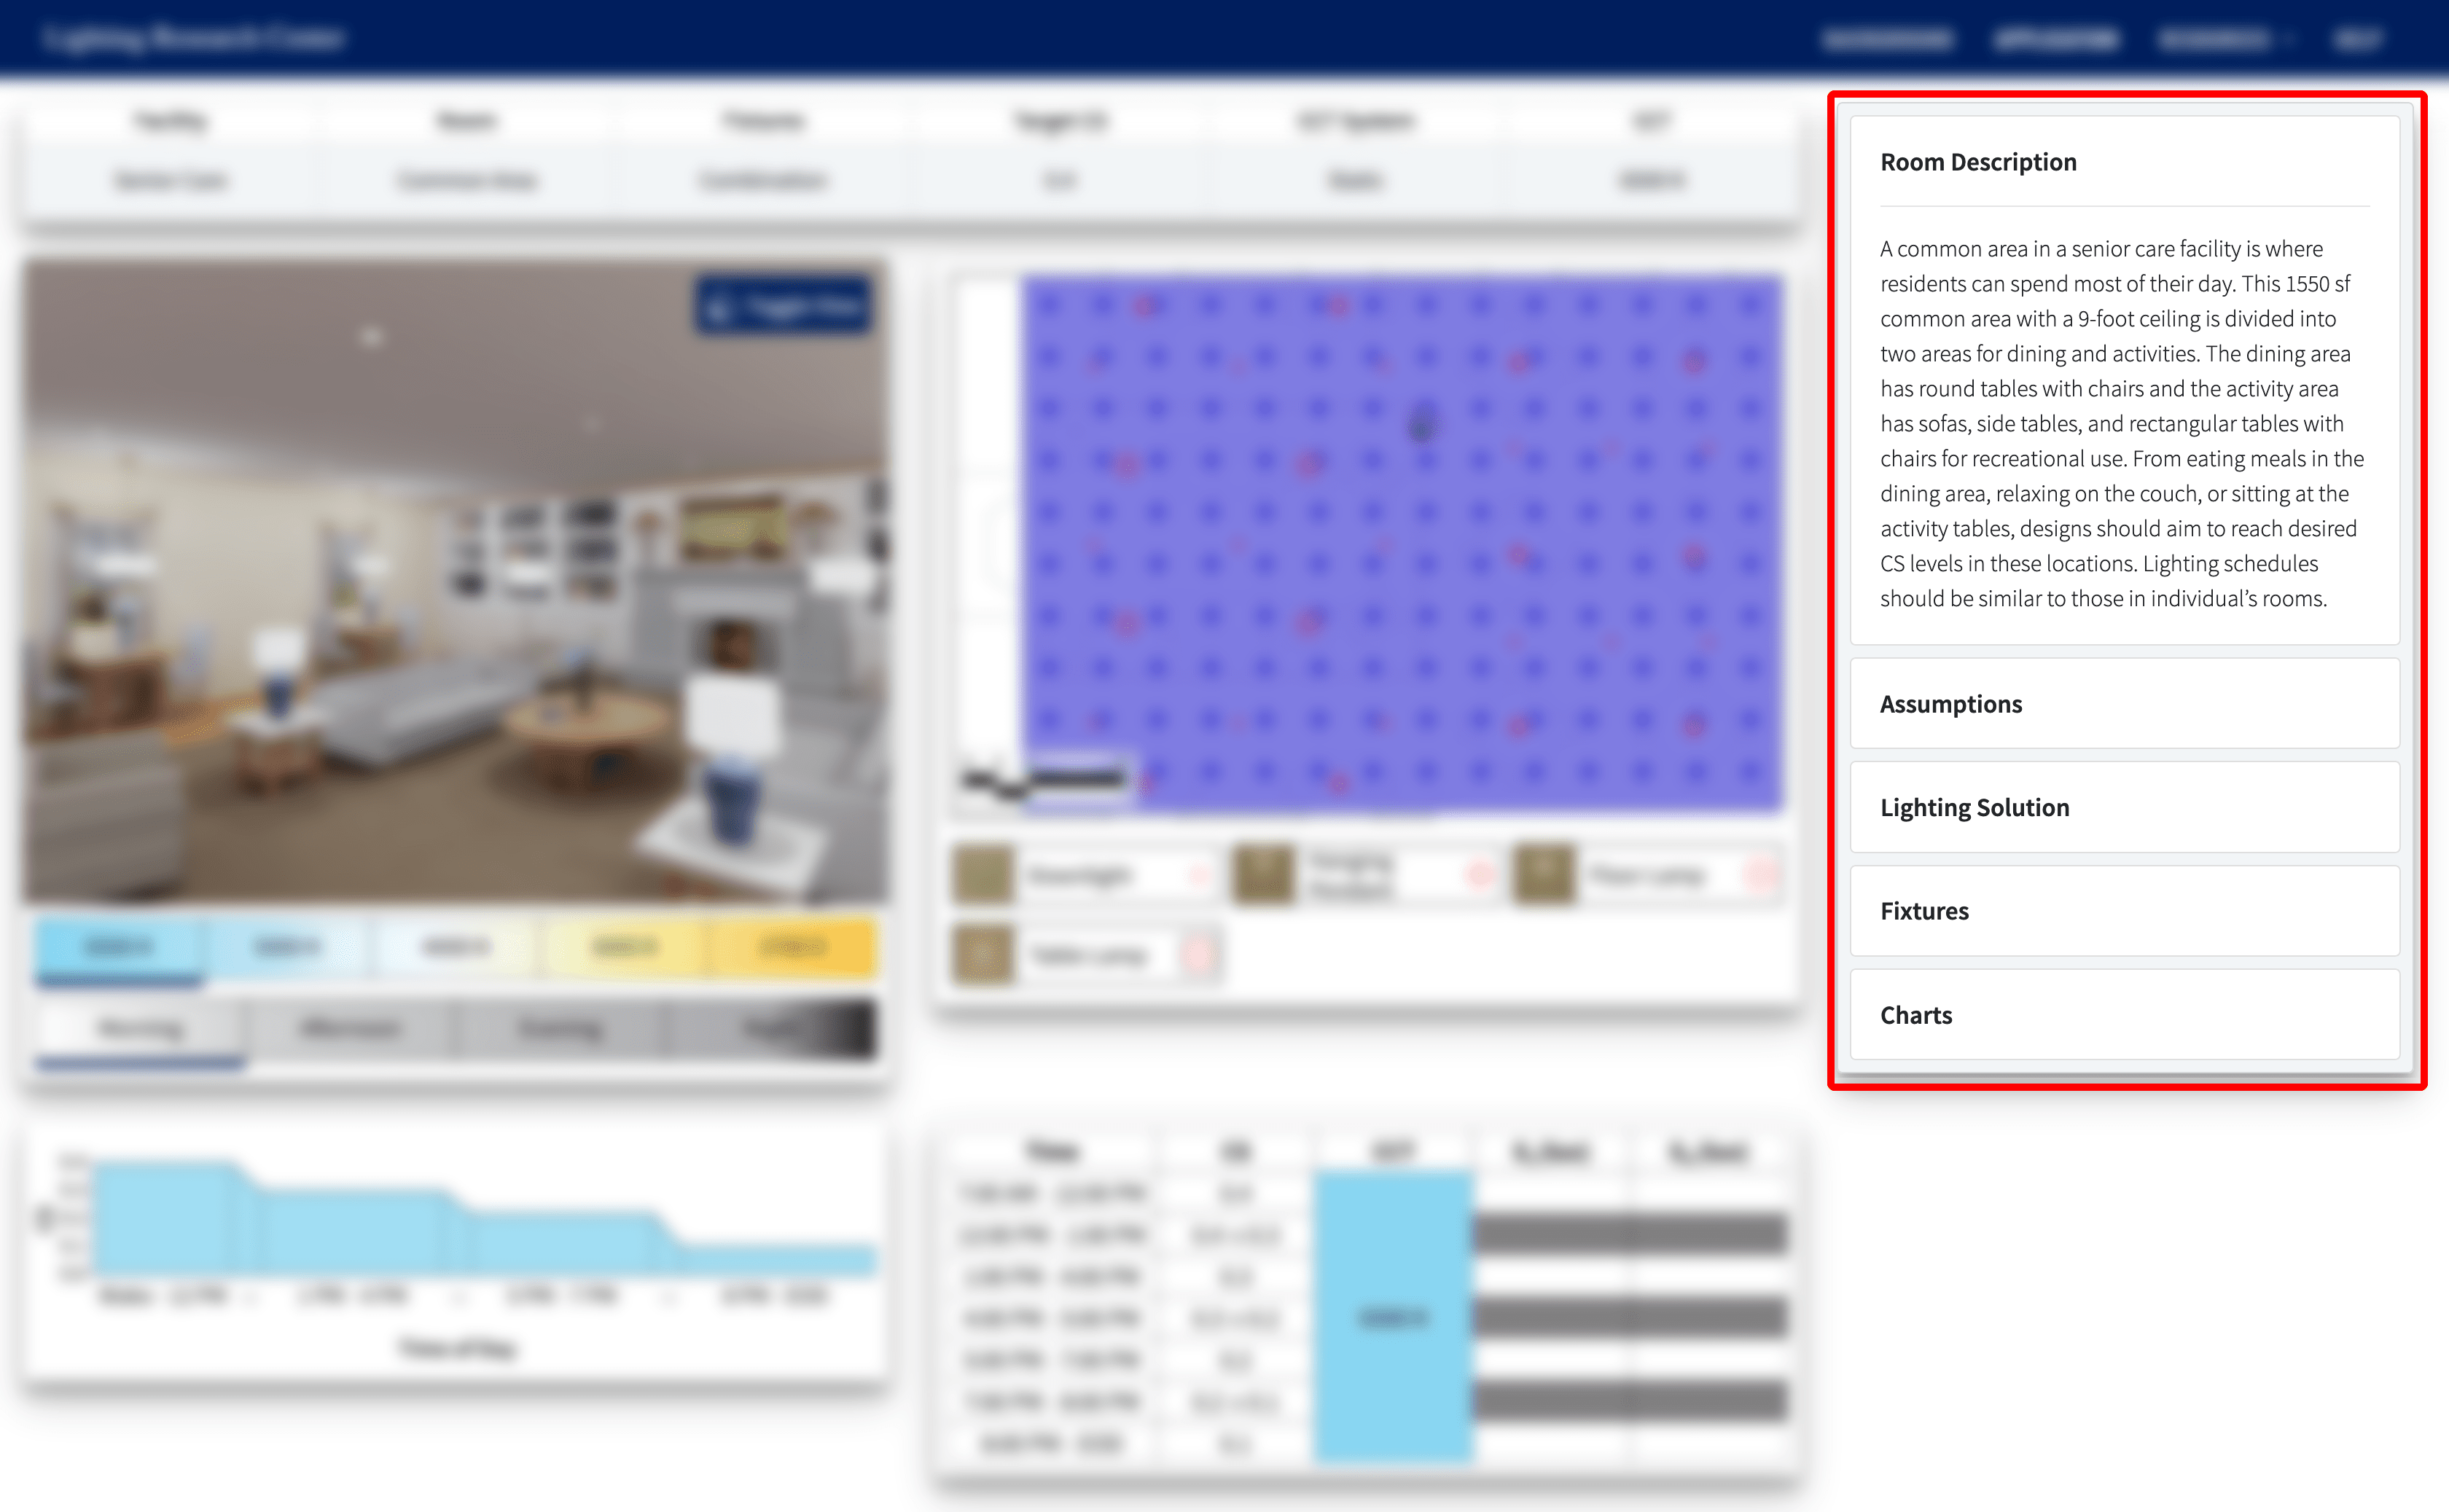
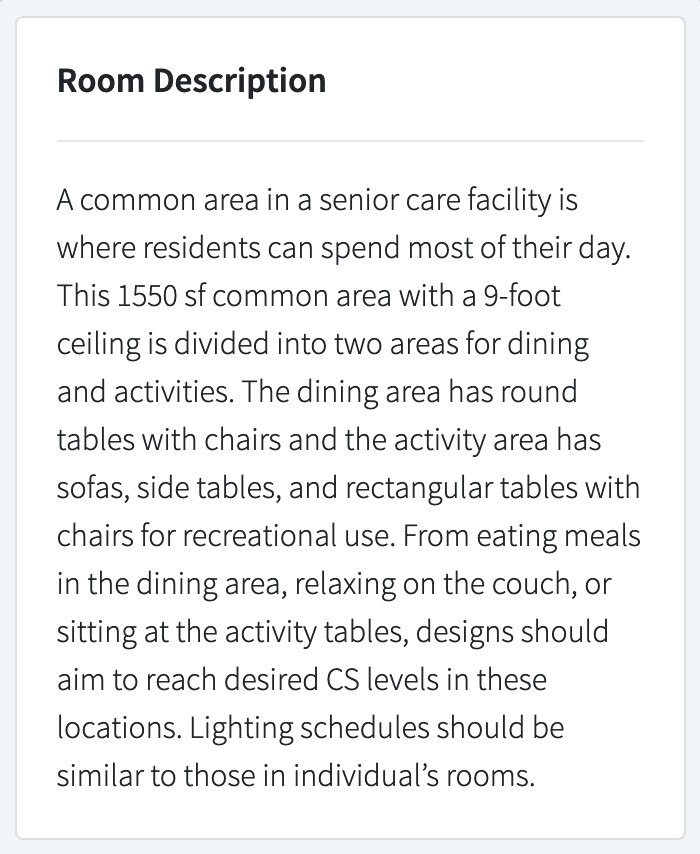
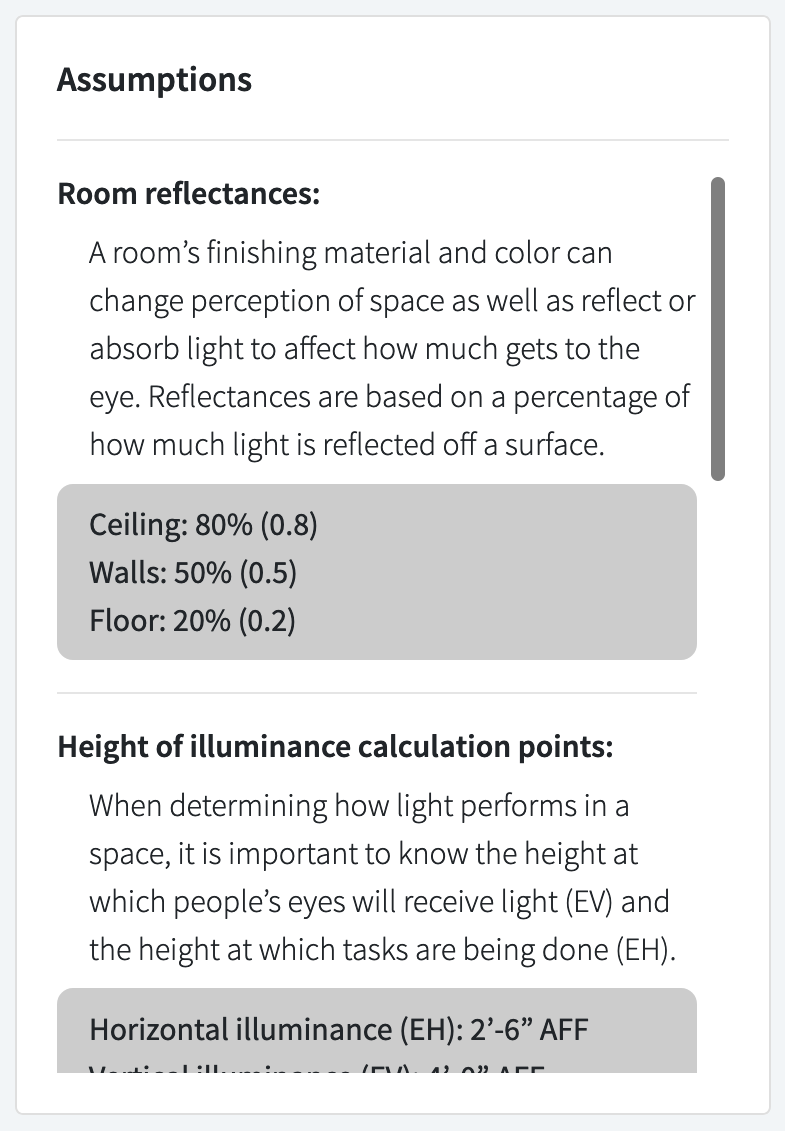
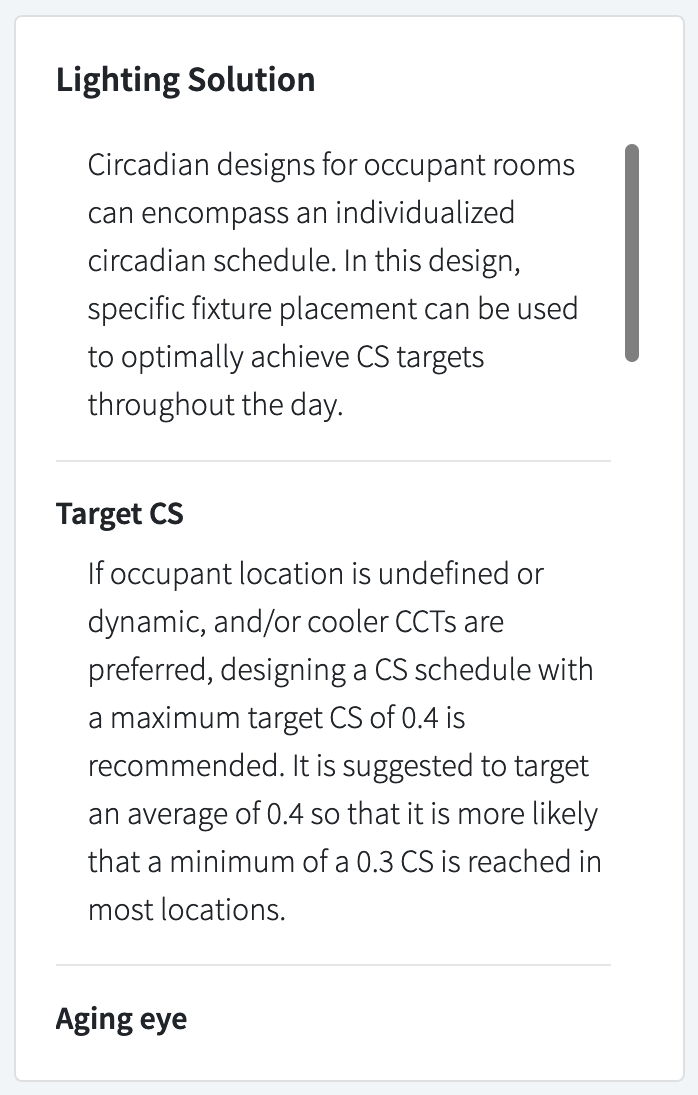
Right Panel